Heatmap - Gravity
The Heatmap - Gravity indicator produces a color-coded map to visualize the accessibility of points, such as POIs from surrounding areas.
1. Explanation
The heatmap Gravity displays a color-coded hexagonal grid showing the accessibility of destinations (opportunities) based on travel time and destination attractiveness. Accessibility is calculated using real-world transport networks and a gravity-based formula that reflects how people’s willingness to travel decreases with distance.
You can specify the routing type, opportunity layer, travel time limit, and adjust sensitivity and destination potential to fine-tune how accessibility is calculated.
The Opportunity layer contains point-based destination data (such as POIs, transit stops, schools, amenities, or custom points). You can select multiple opportunity layers, which will be combined into a single unified heatmap.
The Sensitivity controls how quickly accessibility decreases with increasing travel time, while the Destination potential lets you give more weight to destinations with higher capacity or quality (e.g., a larger supermarket or a bus stop with more departures). Together with the chosen Impedance function, these settings define how accessibility is calculated.
Using Destination potential helps prioritize certain opportunities over others. For example, a larger but farther supermarket can be valued more than a smaller nearby one. This allows you to include qualitative information—such as size, frequency, or service level—when computing accessibility, resulting in a more realistic heatmap.
Influenced by all these properties, the accessibility of a point can model complex real-world human behavior and is a powerful measure for transport and accessibility planning.
Key difference: Unlike the Closest-Average heatmap, which measures travel effort, the Gravity-based Heatmap measures attractiveness — showing how accessible and appealing destinations are when both distance and quality are considered.
Heatmaps are available in certain regions. Upon selecting a Routing type, a geofence will be displayed on the map to highlight supported regions.
If you would like to perform analyses beyond this geofence, feel free to contact us. We would be happy to discuss further options.
2. Example use cases
Which neighborhoods or areas have limited access to public amenities, such as parks, recreational facilities, or cultural institutions, and may require targeted interventions to improve accessibility?
Are there areas with high potential for transit-oriented development or opportunities for improving non-motorized transportation infrastructure, such as bike lanes or pedestrian-friendly streets?
What is the impact of a new amenity on local accessibility?
Is there potential to expand the availability of services such as bike sharing or car sharing stations?
3. How to use the indicator?
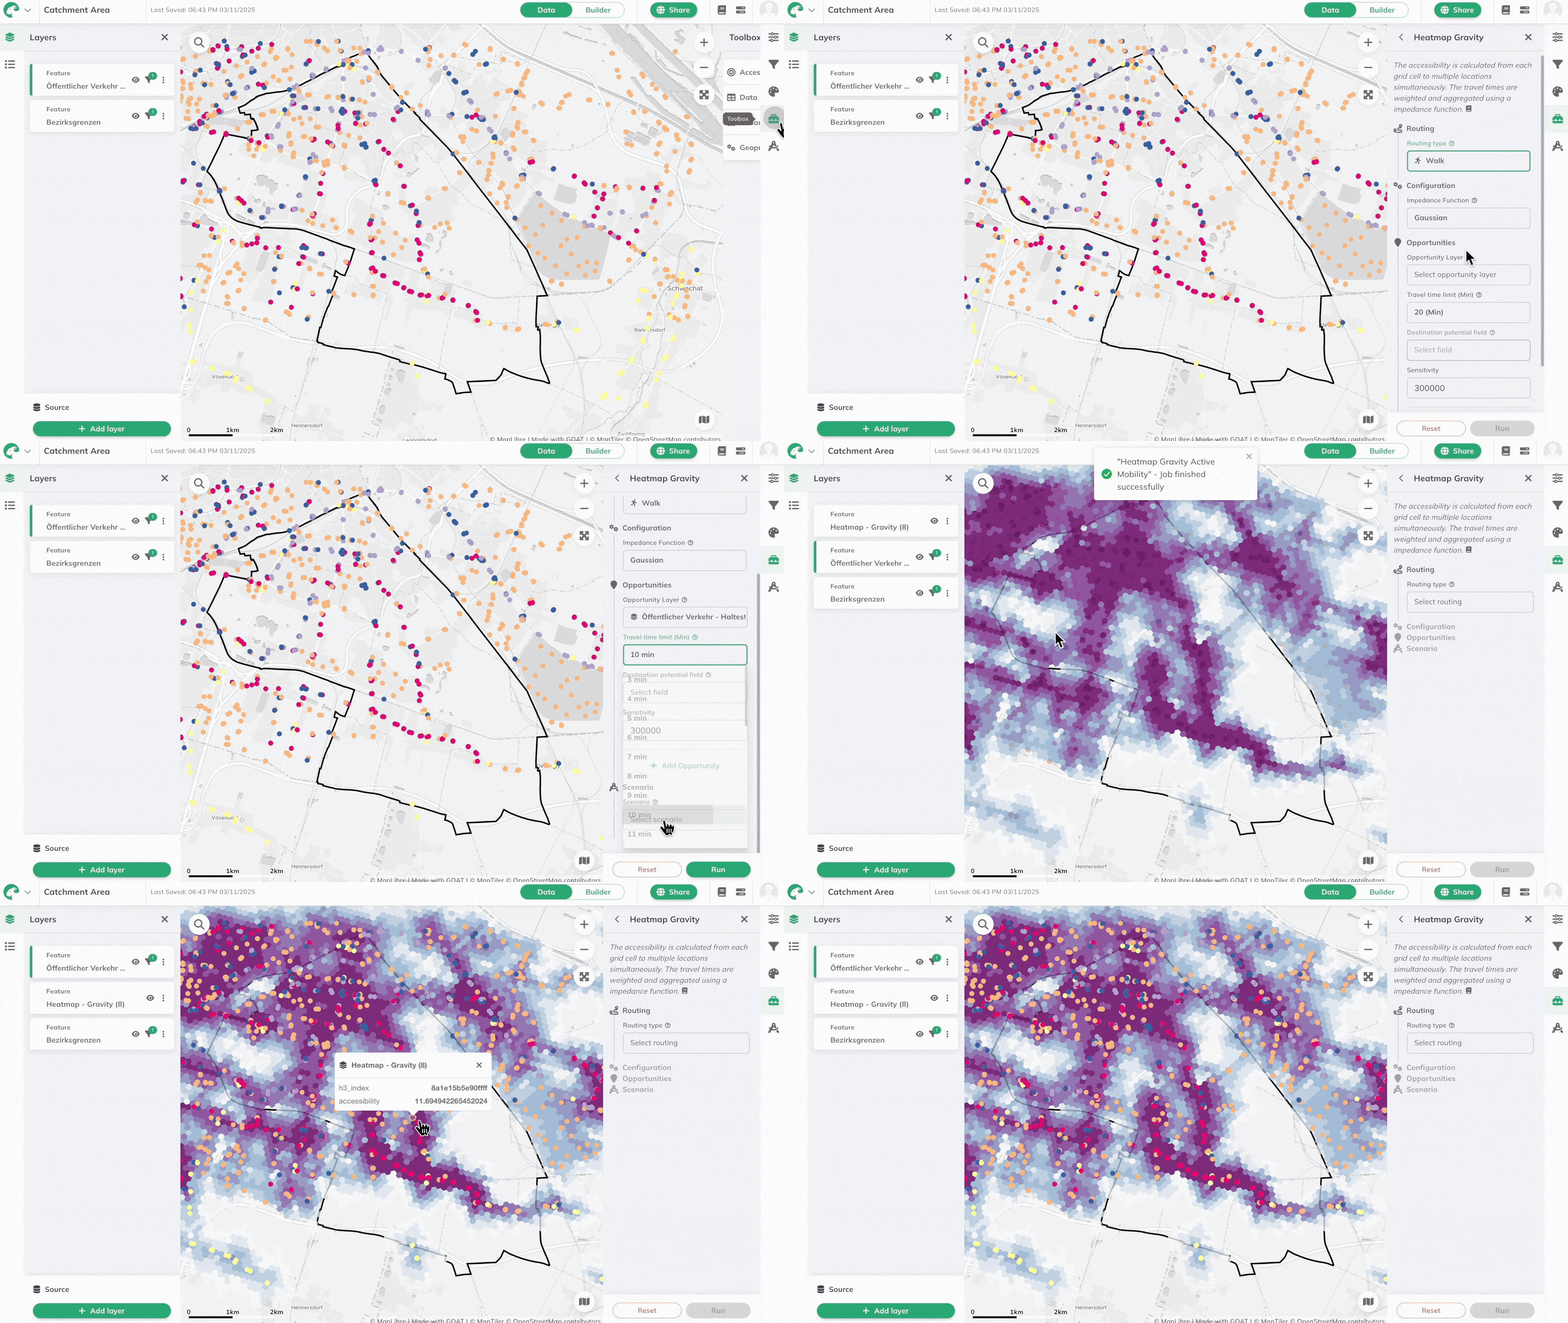
Toolbox Accessibility Indicators menu, click on Heatmap Gravity.Routing
Routing Type you would like to use for the heatmap.- Walk
- Bicycle
- Pedelec
- Car
Considers all paths accessible by foot. For heatmaps, a walking speed of 5 km/h is assumed.
Considers all paths accessible by bicycle. This routing mode takes into account the surface, smoothness and slope of streets while computing accessibility. For heatmaps, a cycling speed of 15 km/h is assumed.
Considers all paths accessible by pedelec. This routing mode takes into account the surface and smoothness of streets while computing accessibility. For heatmaps, a pedelec speed of 23 km/h is assumed.
Considers all paths accessible by car. This routing mode takes into account speed limits and one-way access restrictions while computing accessibility.
Configuration
Impedance Function you would like to use for the heatmap.- Gaussian
- Linear
- Exponential
- Power
This function calculates accessibilities based on a Gaussian curve, which is influenced by the sensitivity and destination_potential you define. For a more in-depth understanding, refer to the Technical details section.
This function maintains a direct correlation between travel time and accessibility, which is modulated by the destination_potential you specify. For a more in-depth understanding, refer to the Technical details section.
This feature is currently under development. 🧑🏻💻
This function calculates accessibilities based on an exponential curve, which is influenced by the sensitivity and destination_potential you define. For a more in-depth understanding, refer to the Technical details section.
This feature is currently under development. 🧑🏻💻
This function calculates accessibilities based on a power curve, which is influenced by the sensitivity and destination_potential you define. For a more in-depth understanding, refer to the Technical details section.
This feature is currently under development. 🧑🏻💻
Opportunities
Opportunity Layer from the drop-down menu. This can be any previously created layer containing point-based data.Travel Time Limit for your heatmap. This will be used in the context of your previously selected Routing Type.Need help choosing a suitable travel time limit for various common amenities? The "Standort-Werkzeug" of the City of Chemnitz can provide helpful guidance.
Destination Potential Field. This must be a numeric field from your Opportunity Layer which will be used as a coefficient by the accessibility function.Sensitivity value. This must be numeric and will be used by the heatmap function to determine how accessibility changes with increasing travel time.How to choose the sensitivity value?
The best sensitivity (β) value depends on your analysis — there’s no single correct number. It defines how quickly accessibility decreases as travel time increases.
- Low β (urban scale): Use a lower sensitivity for city-level analyses. This makes accessibility drop faster with distance, which fits urban contexts where many destinations are nearby and people usually choose the closest one.
- High β (regional scale): Use a higher sensitivity for regional or rural analyses. This makes accessibility decrease more slowly, which reflects that people are willing to travel longer distances when options are fewer.
For a visual explanation of how sensitivity affects the calculation, see the Calculation section.
Run to start the calculation of the heatmap.Results
Once the calculation is complete, a result layer will be added to the map. This Heatmap Gravity layer will contain your color-coded heatmap. Clicking on any of the heatmap's hexagonal cells will reveal the computed accessibility value for this cell.

Want to create visually compelling maps that tell a clear story? Learn how to customize colors, legends, and styling in our Styling section.
Example of calculation
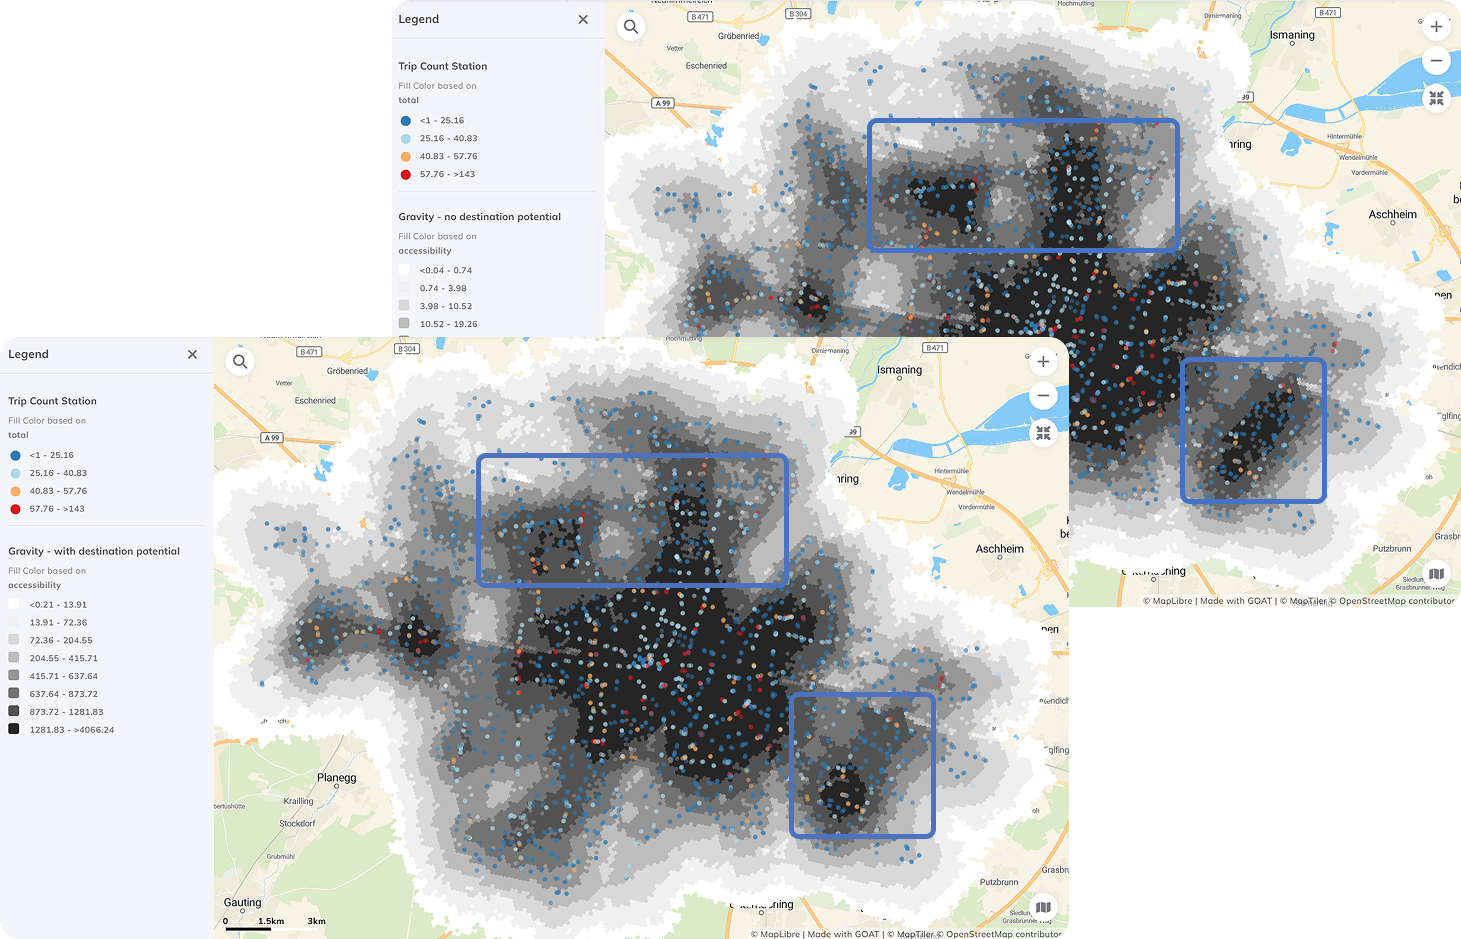
The example below shows how the changes in the opportunity settings can affect the gravity heatmap. Its destination potential is based on the total number of hourly public transport departures from a stop.

The map on the back is calculated without destination potential. The second map used the same settings, but added destination potential based on the total number of departures. This altered the accessibility values of each hexagon and they returned in a wider range, because the highest value increased even more. Higher accessibility values are more concentrated around the stops that have larger trip count (red points).
4. Technical details
Calculation
The accessibility value for each hexagonal cell is calculated using a gravity-based formula, which estimates how strongly destinations influence each location.
Accessibility formula:
In simple terms, the accessibility (A) of a cell (i) depends on:
- the number or importance of destinations (O) nearby, and
- the travel time (tᵢⱼ) needed to reach them.
The function f(tᵢⱼ) reduces the influence of destinations that are farther away — this is called the impedance function. In GOAT you can choose between different impedance types: gaussian, linear, exponential, or power.
and adjust how strongly distance affects accessibility using the sensitivity (β) parameter. If destination potential is included, it further increases the weight of destinations with higher capacity or quality (e.g., larger stores or frequent transit stops).
GOAT uses the following formulas for its impedance functions:
Modified Gaussian, (Kwan,1998):
As studies have shown, the relationship between travel time and accessibility is often non-linear. This means that people may be willing to travel a short distance to reach an amenity, but as the distance increases, their willingness to travel rapidly decreases (often disproportionately).
Leveraging the sensitivity you define, the Gaussian function allows you to model this aspect of real-world behaviour more accurately.
Cumulative Opportunities Linear, (Kwan,1998):
Negative Exponential, (Kwan,1998):
Inverse Power, (Kwan,1998) (power in GOAT):
Travel times are measured in minutes. For a maximum travel time of 30 minutes, destinations that are farther than 30 minutes are considered non-accessible and therefore not considered in the calculation of the accessibility. The sensitivity parameter determines how accessibility changes with increasing travel time. As the sensitivity parameter is decisive when measuring accessibility, GOAT allows you to adjust this. The graph shows how the willingness to walk decreases with increasing travel time based on the selected impedance function and sensitivity value (β).
Classification
In order to classify the accessibility levels that were computed for each grid cell (for color-coded visualization), a classification based on 8 quantile group is used by default. That means, each color covers 12,5 % of the grid cells. The area outside of the computed layer has no access within the defined travel time.

However, various other classification methods may be used instead. Read more in the Data Classification Methods section of the Attribute-based Styling page.
Visualization
Heatmaps in GOAT utilize Uber's H3 grid-based solution for efficient computation and easy-to-understand visualization. Behind the scenes, a pre-computed travel time matrix for each routing type utilizes this solution and is queried and further processed in real-time to compute accessibility and produce a final heatmap.
The resolution and dimensions of the hexagonal grid used depend on the selected routing type:
- Walk
- Bicycle
- Pedelec
- Car
- Resolution: 10
- Average hexagon area: 11285.6 m²
- Average hexagon edge length: 65.9 m
- Resolution: 9
- Average hexagon area: 78999.4 m²
- Average hexagon edge length: 174.4 m
- Resolution: 9
- Average hexagon area: 78999.4 m²
- Average hexagon edge length: 174.4 m
- Resolution: 8
- Average hexagon area: 552995.7 m²
- Average hexagon edge length: 461.4 m
For further insights into the Routing algorithm, visit Routing. In addition, you can check this Publication.
5. References
Kwan, Mei-Po. 1998. “Space-Time and Integral Measures of Individual Accessibility: A Comparative Analysis Using a Point-Based Framework.” Geographical Analysis 30 (3): 191–216. https://doi.org/10.1111/j.1538-4632.1998.tb00396.x.
Vale, D.S., and M. Pereira. 2017. “The Influence of the Impedance Function on Gravity-Based Pedestrian Accessibility Measures: A Comparative Analysis.” Environment and Planning B: Urban Analytics and City Science 44 (4): 740–63. https://doi.org/10.1177%2F0265813516641685.
Higgins, Christopher D. 2019. “Accessibility Toolbox for R and ArcGIS.” Transport Findings, May. https://doi.org/10.32866/8416.