ÖV-Güteklassen
The ÖV-Güteklassen indicator classifies the quality of public transport services in a given area, helping planners and stakeholders quickly identify well-served and underserved locations.
1. Explanation
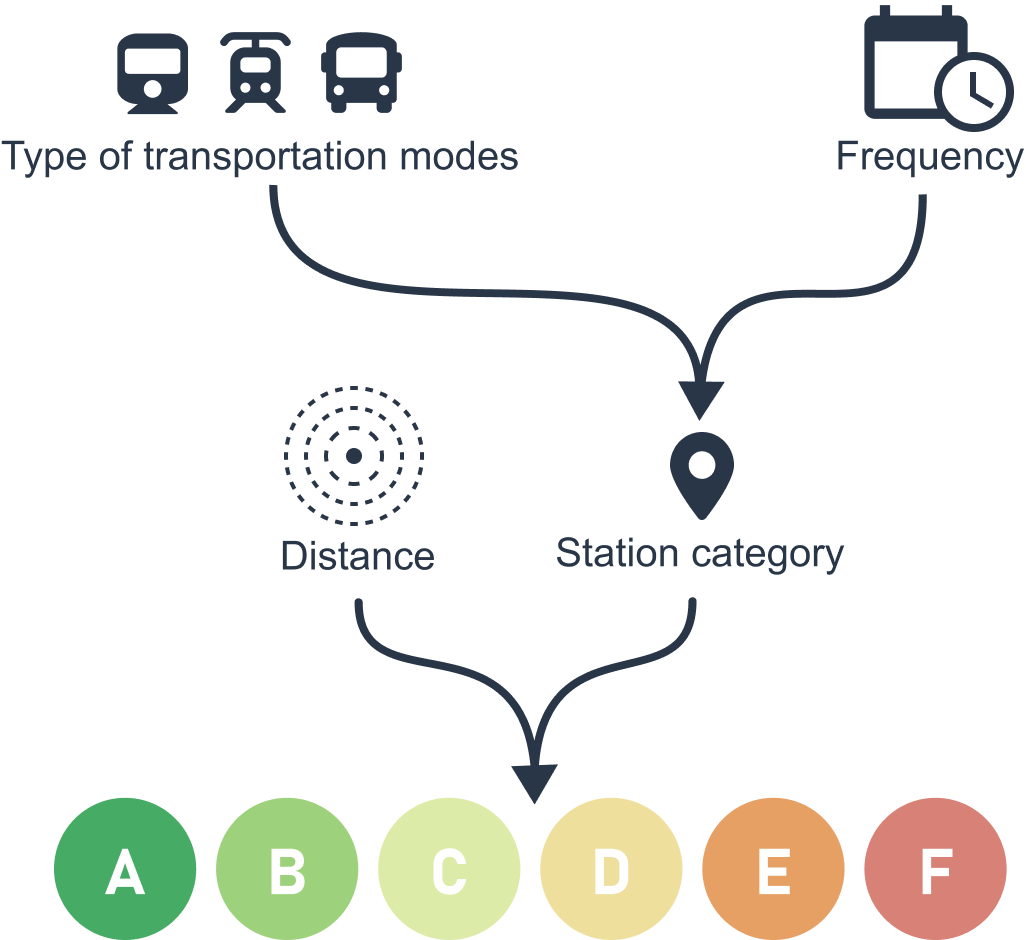
ÖV-Güteklassen (Public Transport Quality Classes) provide a standardized way to evaluate and visualize the attractiveness of public transport services. The classes range from A (very good) to F (very poor), based on service frequency, station type, and spatial coverage.
The ÖV-Güteklassen indicator is decisive and can be used to highlight deficits in the public transport offer and to identify well-serviced locations as attractive areas for development.
The calculation of the public transport quality classes is only available for areas where the transport network is integrated into GOAT.
In case you need to perform analysis beyond this geofence, feel free to contact the Support and we will check what is possible.
2. Example use cases
- How good is public transport supply in different parts of the city?
- How many people are underserved by public transport? Where is the need for further supply?
- How does the quality of public transport services differ at different times of the week and day?
3. How to use the indicator?
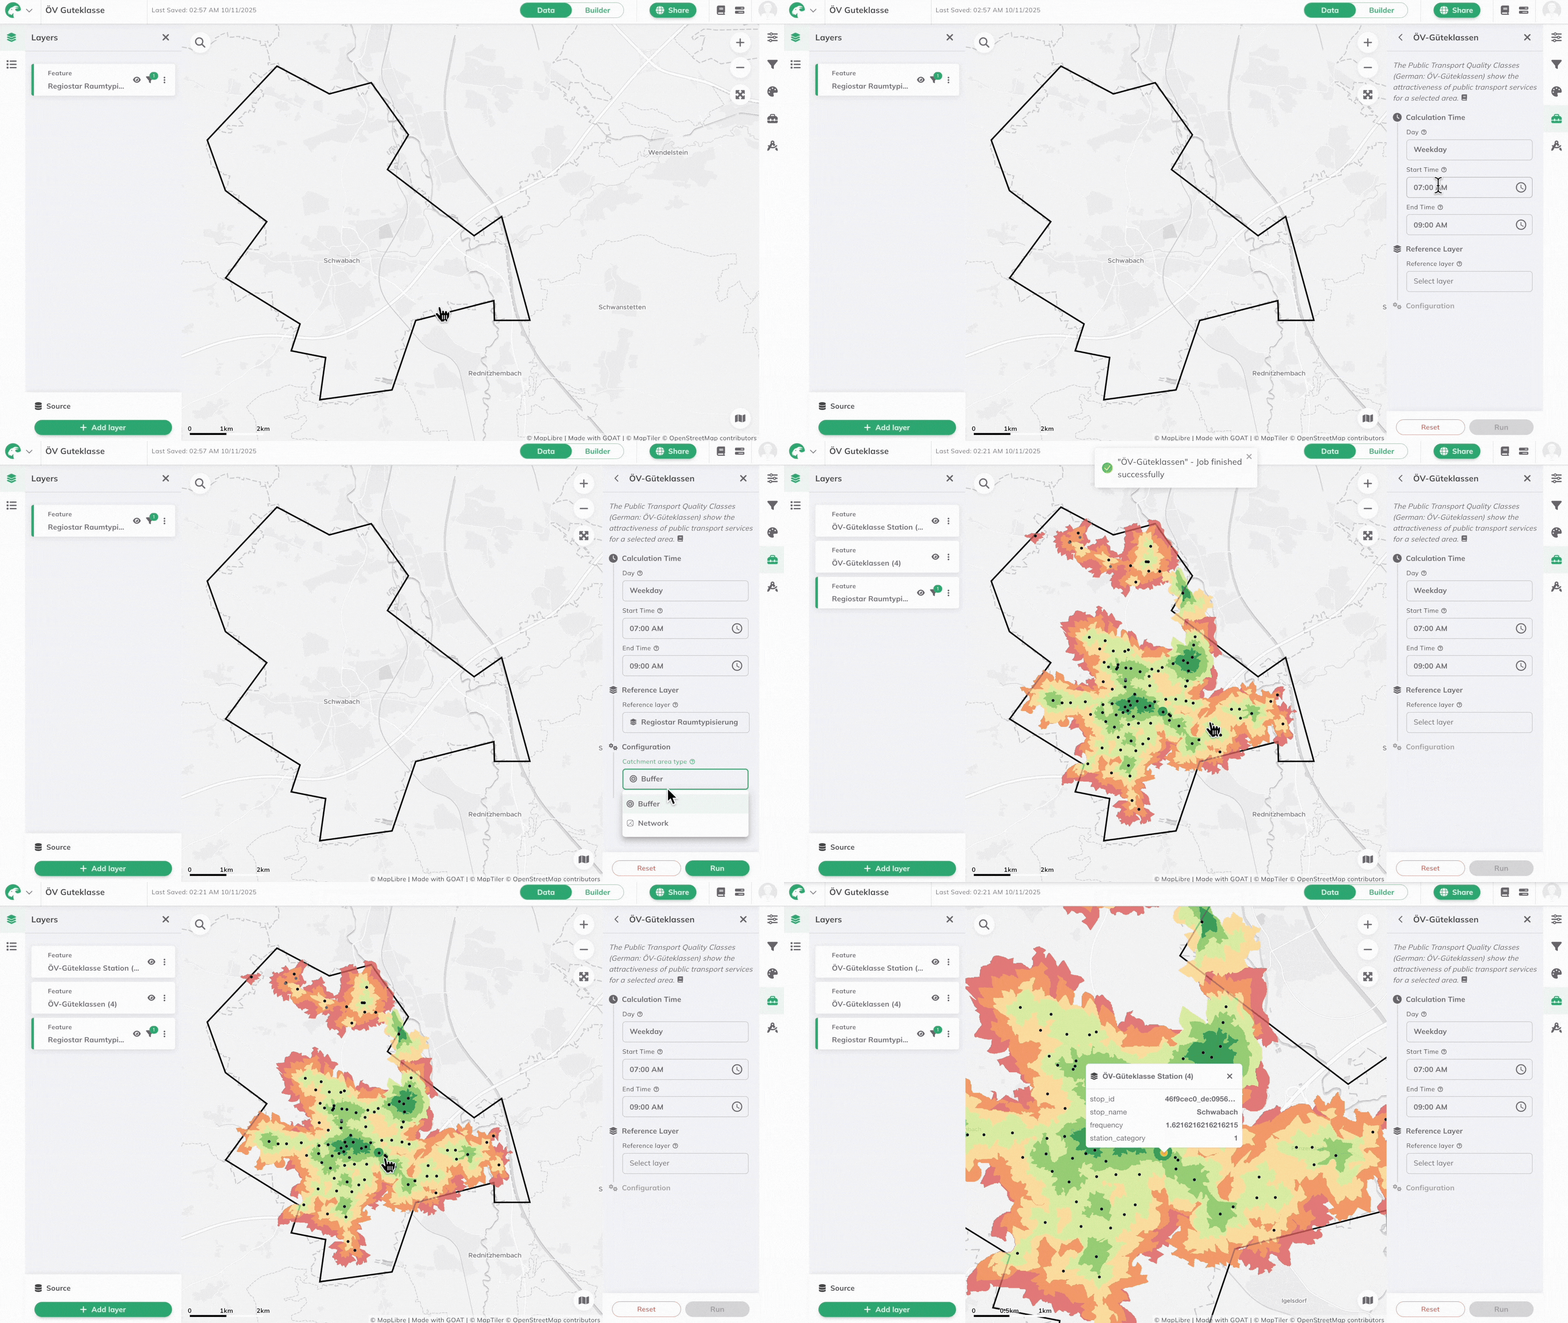
Toolbox Accessibility Indicators, select ÖV-Güteklassen to open the settings menu.Calculation Time
Day, Start Time, and End Time for your analysis.Reference Layer
Reference Layer (polygon feature layer) for the area you want to analyze.Configuration
Catchment area type: Buffer or Network.Buffers represent areas around public transport stations measured "as the crow flies", while network catchment areas account for the same distances along real-world streets and paths.
Run to start the calculation.Results
After calculation, two layers are added to the map:
- ÖV-Güteklassen: Shows the quality class for each area.
- ÖV-Güteklassen Stations: Shows all stations used in the calculation (grey points = too low frequency, don't contribute to any PT Quality Class).
If you click on a ÖV-Güteklassen result your will see the further details, such as Public Transport Class and Public Transport Class Number. Both represent the quality of public transport in that area (see calculation for more details).
If you click on any station, you can see details such as the stop name, average frequency, and station category.

4. Technical details
Scientific Background
The approach of Public Transport Quality Classes (German: ÖV-Güteklassen) is methodologically superior compared to common catchment areas. In 2011, the Swiss Federal Office for Spatial Development (ARE) started to use this indicator to include the attractiveness of public transport services in the assessment of quality development; since then, it has been considered an important instrument in formal planning processes in Switzerland. Later on, the Swiss model served as an inspiration for its application in Austria (e.g. Voralberg) and Germany (e.g. by KCW and Agora Verkehrswende).
The institutionalization of the indicator in German-speaking countries, as well as the comprehensible and at the same time differentiated calculation methodology, are important advantages of the ÖV-Güteklassen.
Calculation
In the Swiss version of the indicator, the calculation of the quality classes is usually carried out for departures on weekdays between 6 AM and 8 PM. For the use in GOAT, the calculation period was made more flexible so that the indicator can be calculated for any day of the week and time of day.
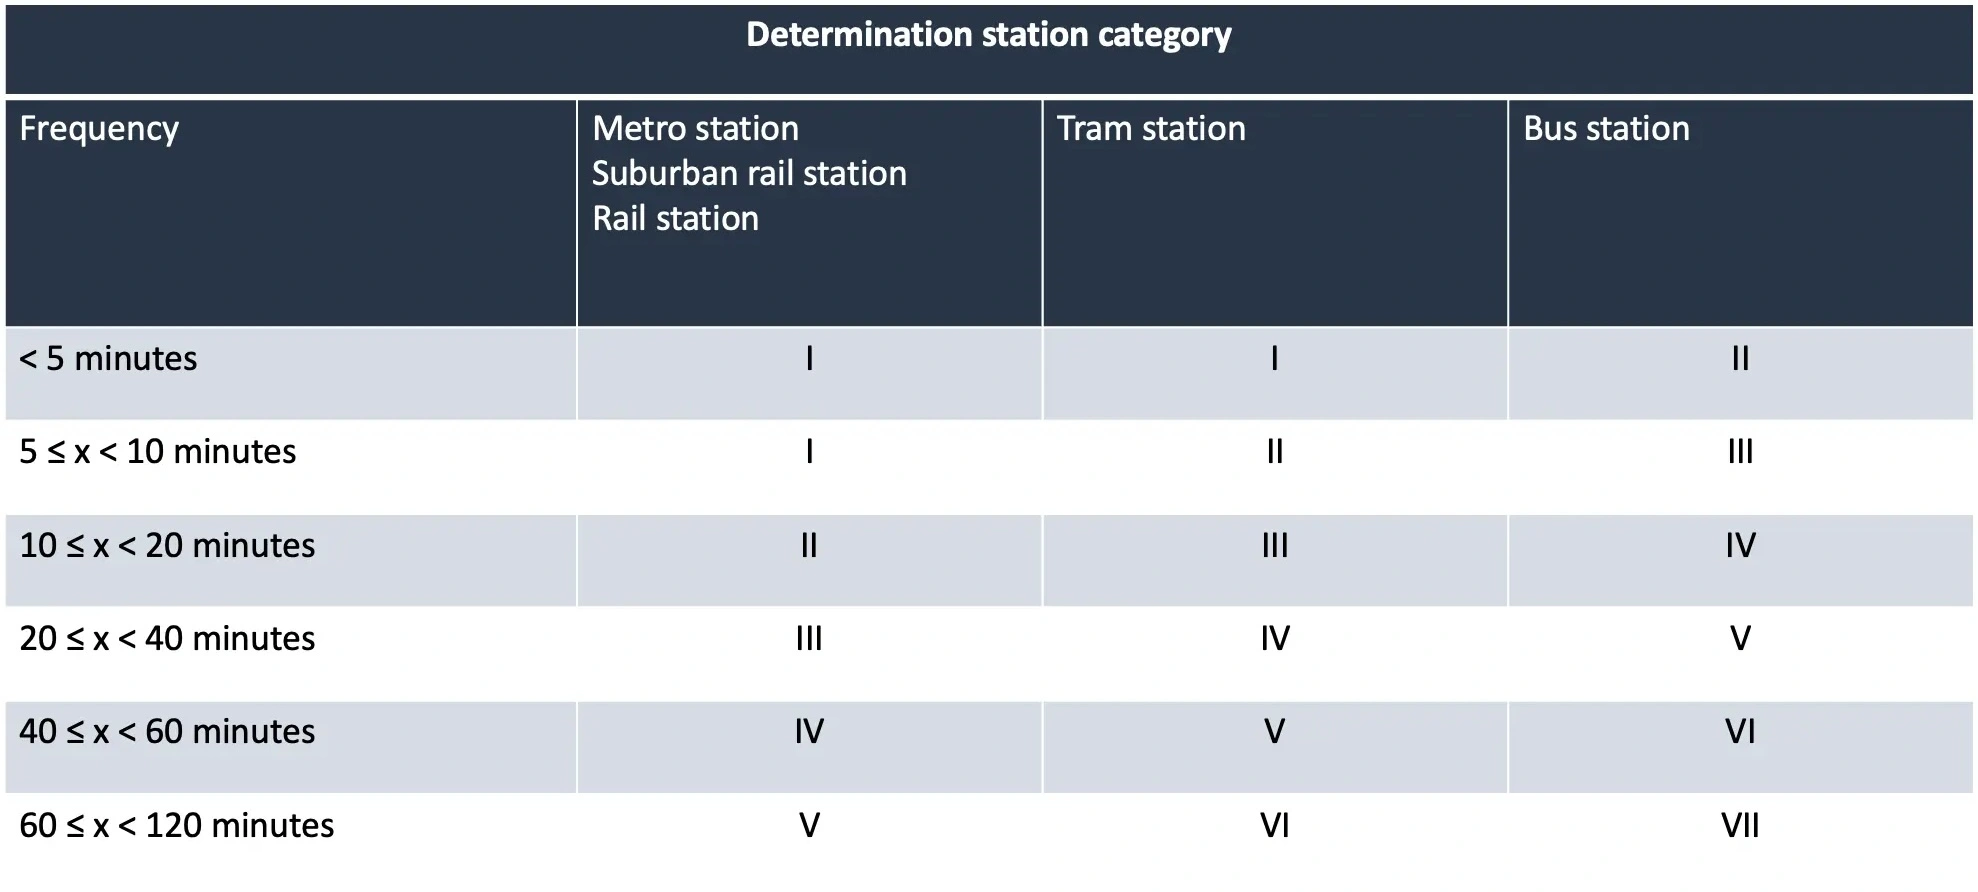
The calculations are carried out based on GTFS data (see Built-in Datasets): First, the number of departures per public transport mode (train, metro, tram, and bus) is dynamically calculated for each station. The sum of the departures is divided by two to calculate the frequency, to eliminate the outward and return directions. In the next step, the average frequency for the selected time interval is calculated. The higher-value service is selected as the station type in the case of service by several means of transport. For example, in the case of buses and trains, this is the train. With the help of the table below, as well as the station type and the frequency, the station category can now be determined.
Calculation steps
- Departures per station: Calculate the number of departures per mode (train, metro, tram, bus) for each station using GTFS data (see Built-in Datasets).
- Frequency: The sum of the departures is divided by two to eliminate the outward and return directions.
- Station type: For each station, determine the highest-ranking mode of transport served (e.g., if both bus and train are available, the station is classified as a train station).
- Category assignment: Use the station type and frequency to determine the category (see table below).
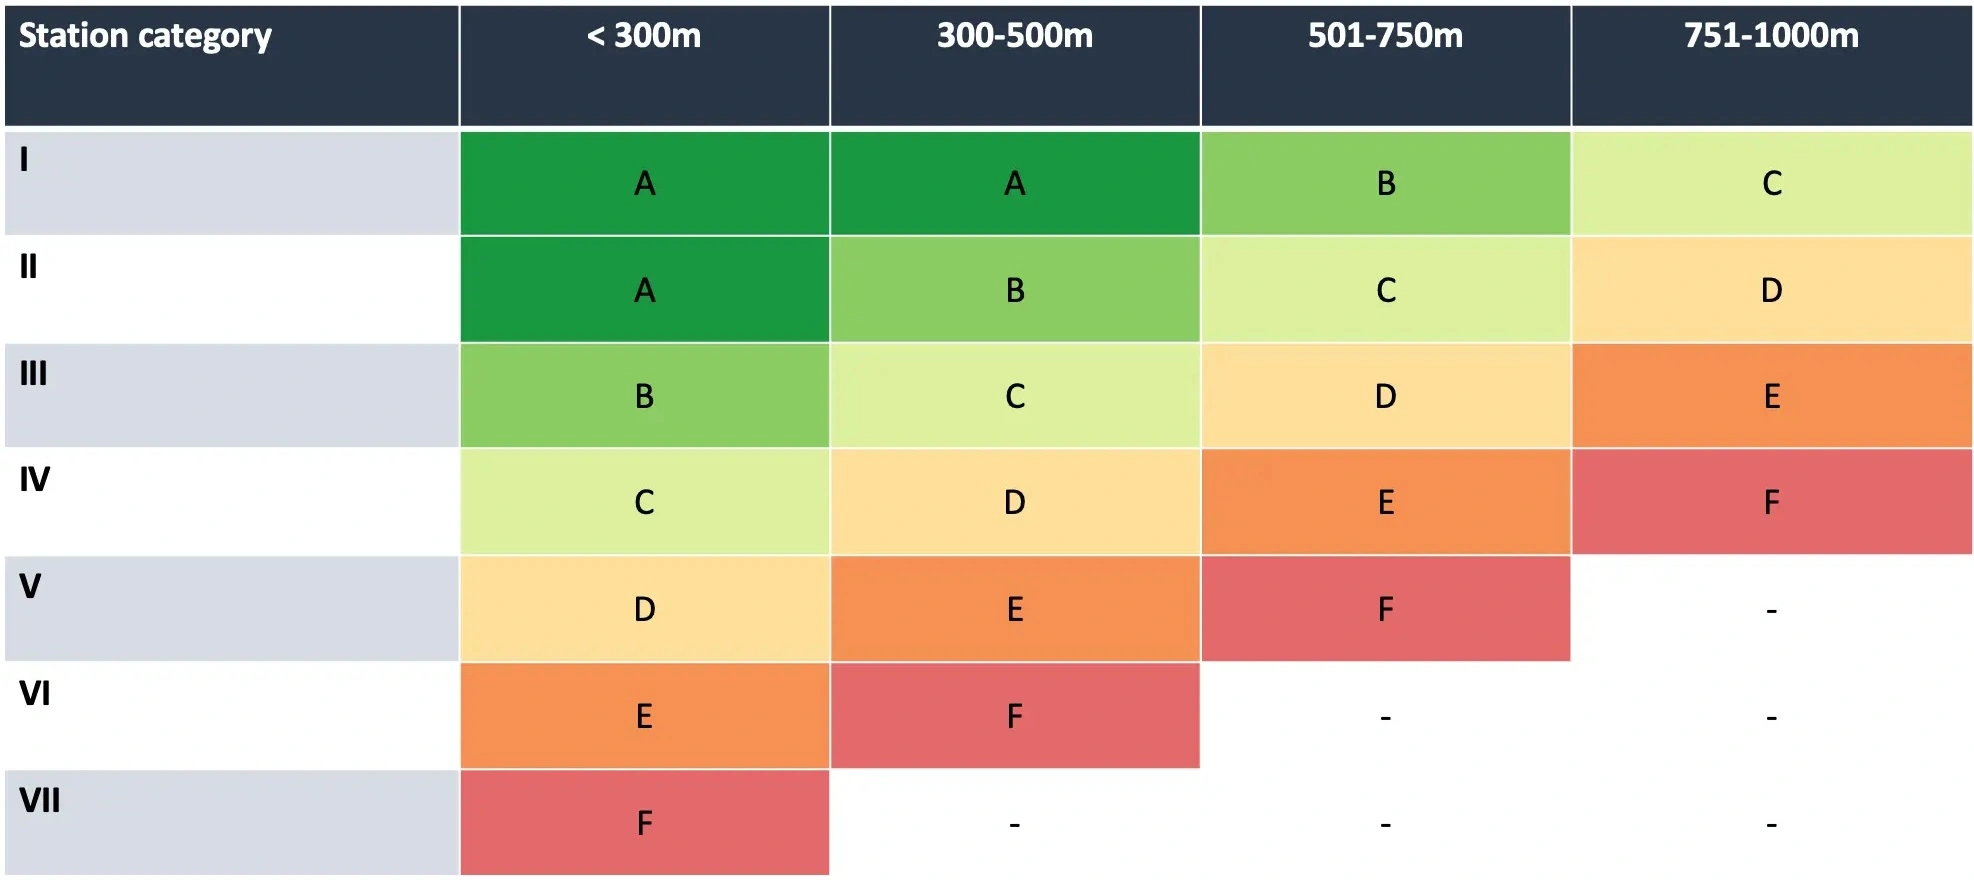
- Catchment areas: Create buffers or network isochrones for each station category.
- Merge areas: Overlapping areas are merged, with the higher-quality class taking precedence.


Visualization
The created buffers/network catchment areas are visualized around the stations in the corresponding colors to highlight the quality class (A-F).

5. Further readings
Sample projects where ÖV-Güteklassen was used:
- Germany-Wide Assessment of Public Transport Accessibility Through Public Transport Quality Classes white paper
- Accessibility analyses for the "Mobility Guarantee" and "Public Transport Atlas" projects
- Calculation of public transport quality classes in Austria
- Calculation of public transport quality classes in Germany
6. References
Bundesamt für Raumentwicklung ARE, 2022. ÖV-Güteklassen Berechnungsmethodik ARE (Grundlagenbericht).
Hiess, H., 2017. Entwicklung eines Umsetzungskonzeptes für österreichweite ÖV-Güteklassen.
metron, 2017. Bedienungsqualität und Erschließungsgüte im Öffentlichen Verkehr.
Shkurti, Majk, 2022. "Spatio-temporal public transport accessibility analysis and benchmarking in an interactive WebGIS". url: https://www.researchgate.net/publication/365790691_Spatio-temporal_public_transport_accessibility_analysis_and_benchmarking_in_an_interactive_WebGIS