PT Trip Count
This indicator displays the average number of public transport departures per hour for each public transport stop.
1. Explanation
The Public Transport (PT) Trip Count shows the average number of departures per hour for a selected time interval at each public transport stop. You can view the sum for all modes or focus on a specific mode (e.g., bus, tram, metro, rail).
This indicator is the foundation for the ÖV-Güteklassen and is useful for weak point analyses of local transport plans (see, among others, Guideline for Local Transport Planning in Bavaria).
The public transport (PT) trip count is only available in areas where the transport network is integrated into GOAT.
In case you need to perform analysis beyond this geofence, feel free to contact the Support and we will check what is possible.
2. Example use cases
- Which stations in the city serve as main hubs?
- Which stations have low service rates in comparison to others?
- How does the public transport quality vary over different times of the week or day?
3. How to use the indicator?
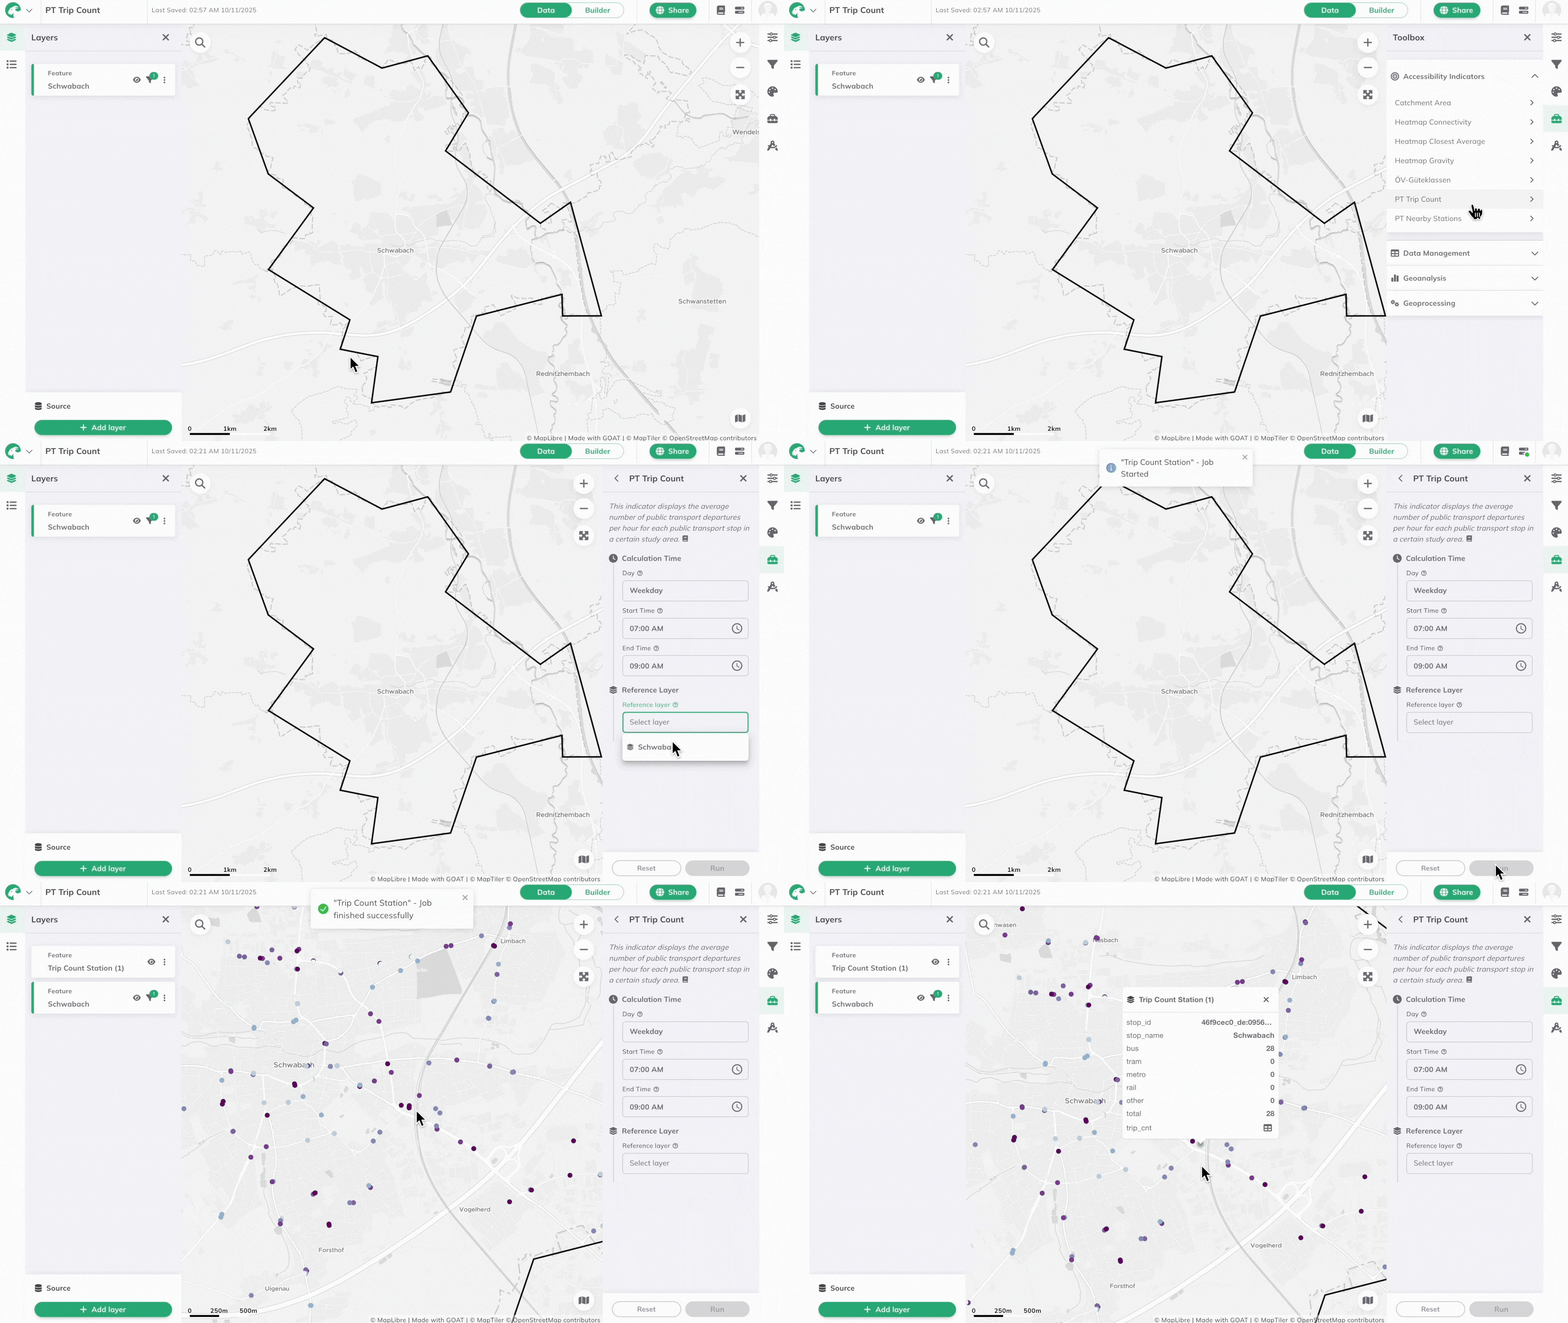
Toolbox Accessibility Indicators, select PT Trip Count to open the settings menu.Calculation Time
Day, Start Time, and End Time for your analysis.Reference Layer
Reference Layer (polygon feature layer) for the area you want to analyze.Run to start the calculation.Results
When the calculation is finished, a new layer called "Trip Count Station" will be added to the map.
Click on stations to view details including station name, total departure count, and departure counts per mode.

If you are interested in one specific mode, e.g. only busses, you can use the attribute-based styling to adjust the point color based on that desired column.
4. Technical details
Similar to the Public Transport Quality Classes (German: ÖV-Güteklassen), this indicator is calculated based on GTFS data (see Built-in Datasets). Based on the selected day and time window, the average number of departures per hour (regardless of direction) is calculated.
5. References
Shkurti, Majk (2022). Spatio-temporal public transport accessibility analysis and benchmarking in an interactive WebGIS