Inbuilt Datasets
Data as an important basis for analyses
At Plan4Better, we recognize that data is the fuel that powers our analyses, making it our most valuable asset. To deliver accurate insights based on high-quality information, our WebGIS platform GOAT integrates a variety of diverse geospatial and non-geospatial datasets from various sources. However, processing inconsistent data from different sources with varying degrees of accuracy can pose a significant challenge. To address this issue, we leverage a range of techniques including efficient data integration, disaggregation, and fusion workflows.
Data collection and preparation
The data collection process involves identifying relevant data sources and collecting data - ideally from open data portals or publicly available initiatives. Depending on the data source, various formats such as shapefiles and GeoJSON may be used. It is therefore essential to prepare and convert the data into a common schema and format to ensure consistency and comparability.
Data integration and fusion steps are applied to combine the different datasets and adapt them to the local context. Validation processes are implemented to ensure accurate and reliable data, and we are always open to including additional datasets and data sources as needed.
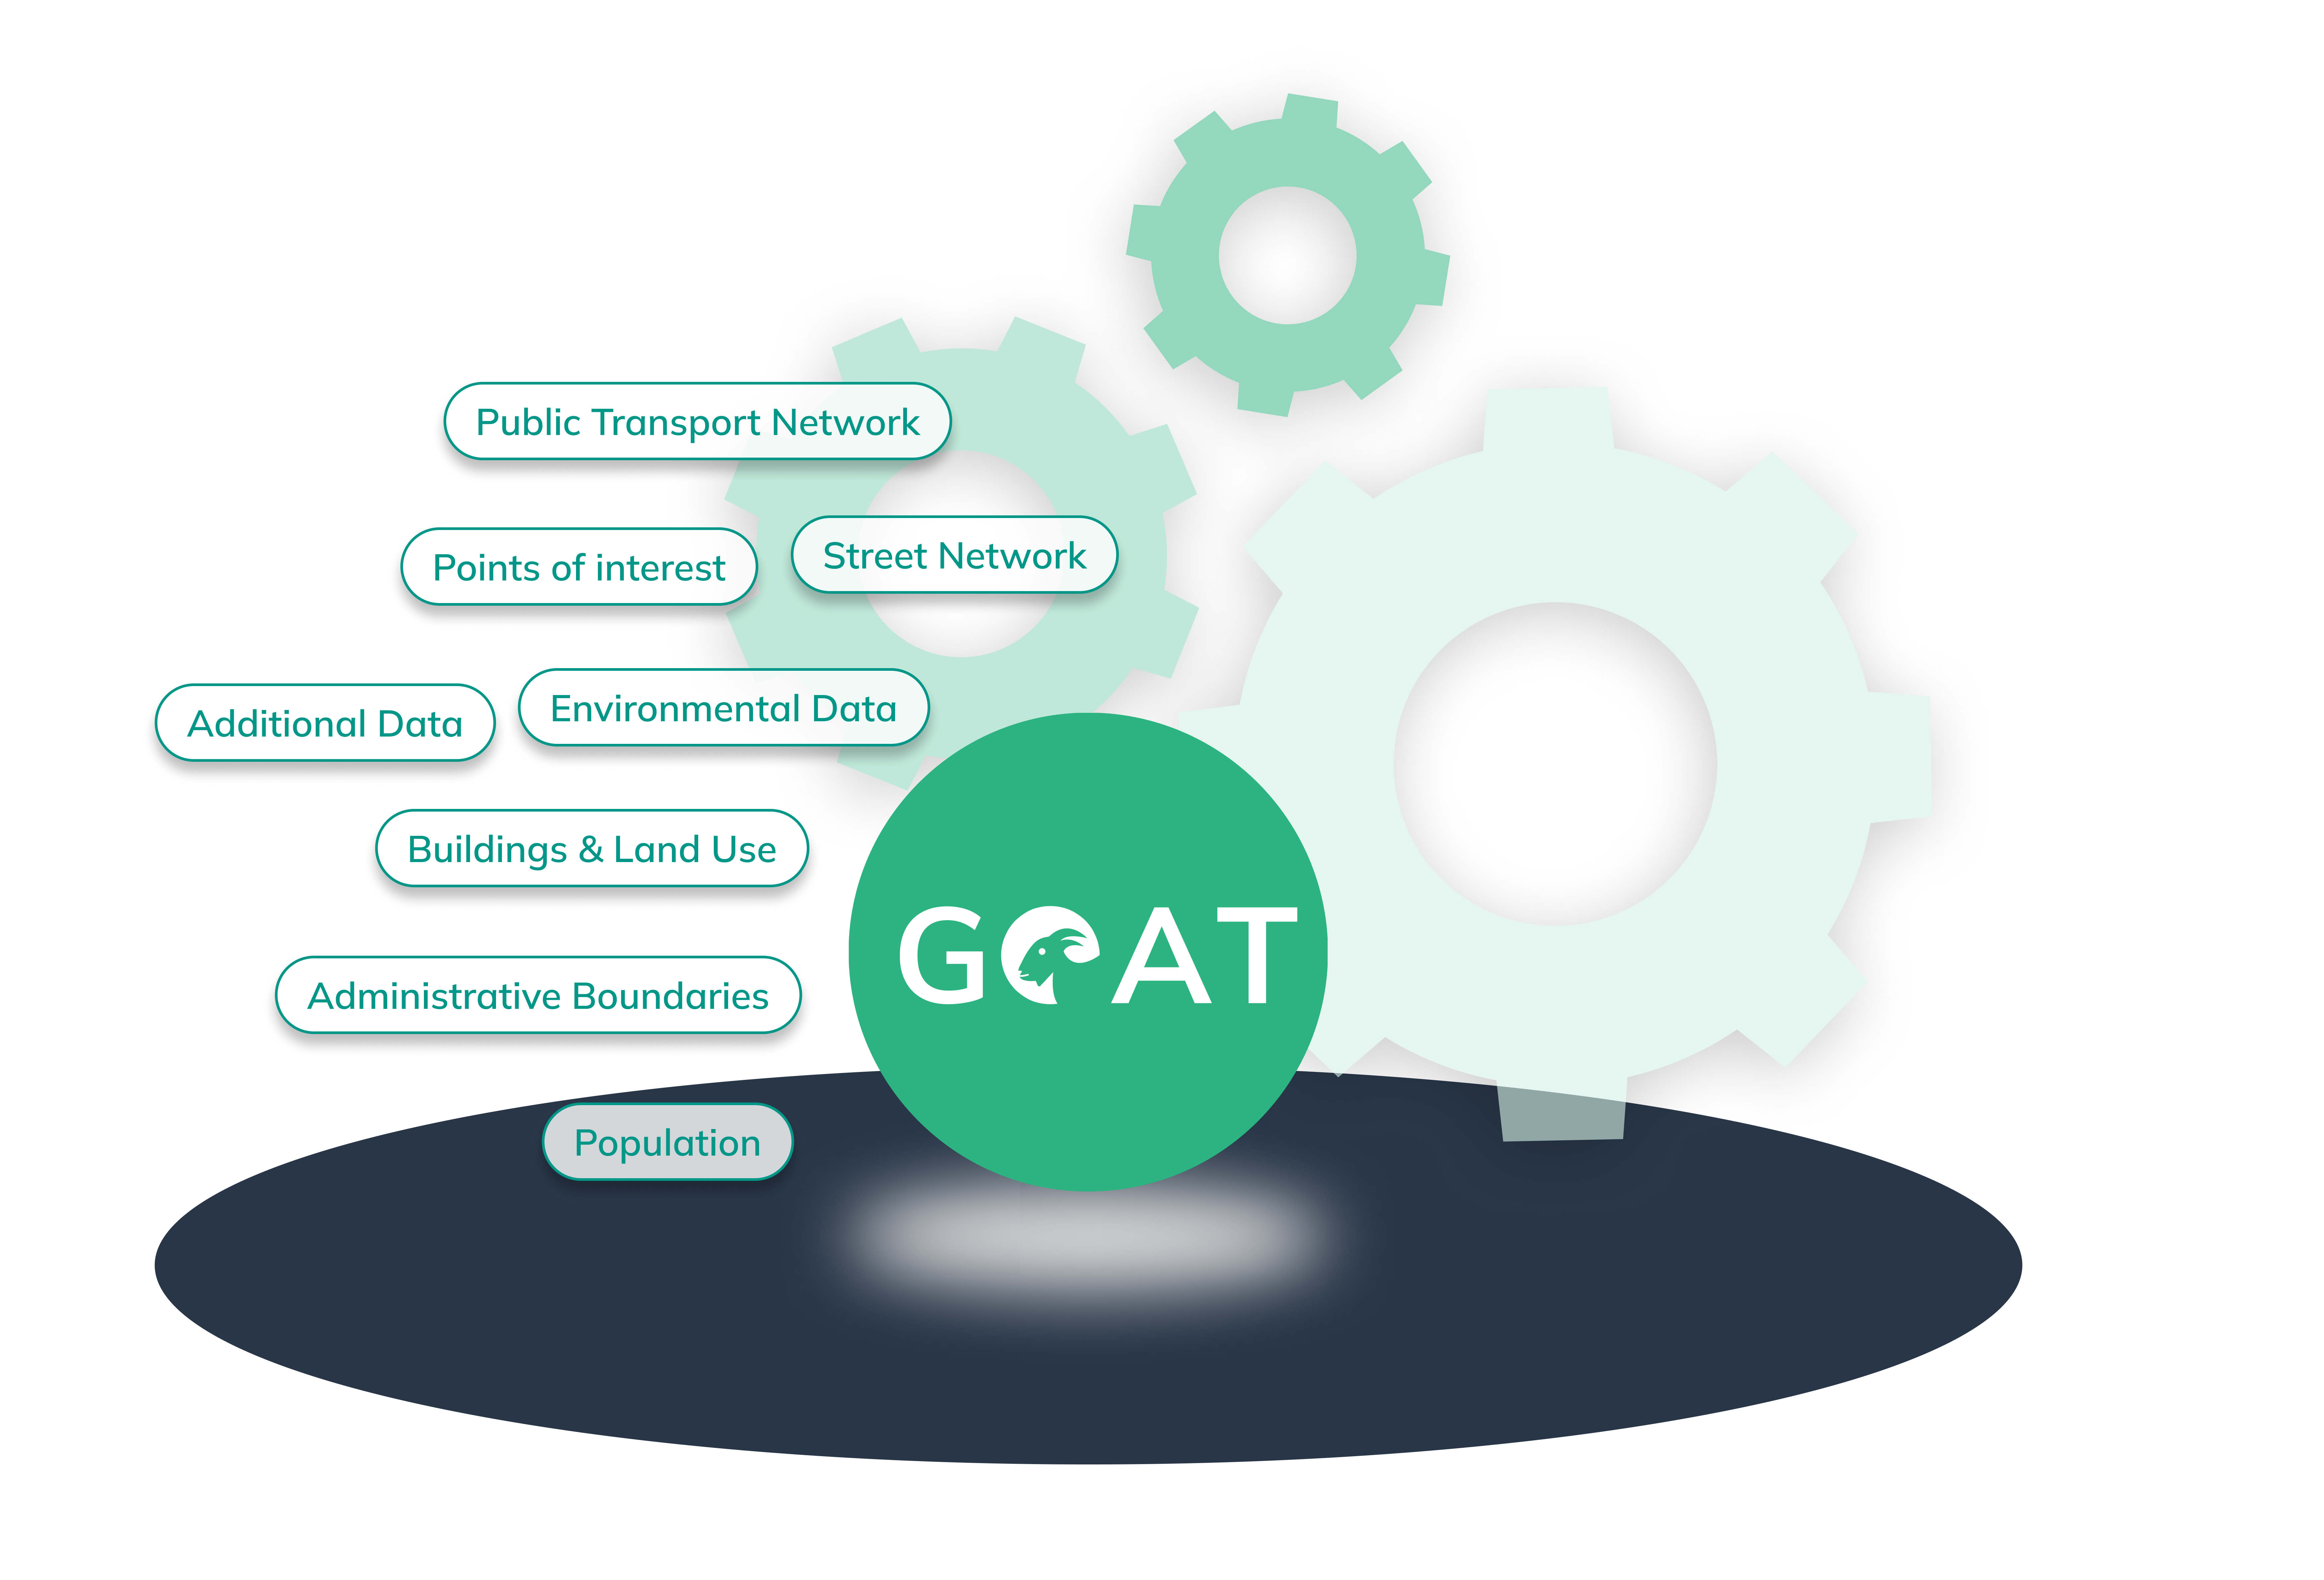
At Plan4Better, we ensure that our data is up-to-date by updating it at least once a year. However, more frequent updates are possible when necessary, especially for rapidly changing points of interest (POIs) and public transport data. The figure below illustrates the primary dataset types used, while the next section describes each type in further detail.

Datasets in the Catalog
The following datasets are available via the Catalog. These are managed as feature layers containing geospatial features (points, lines, or polygons) or non-geospatial data (in a tabular format), and can be added to your projects for analysis and visualization. While not an exhaustive list of available layers, the following information provides an overview of the primary dataset types.
This section provides technical details about datasets available in the Catalog. For a general overview of the Catalog and guidance on adding datasets to your projects, please refer to the Catalog page.
Points of Interest (POIs)
Locations of common amenities, facilities, and trip-attractors that are necessary for accessibility planning.
Features:
- Public transport stops
- Shopping centers
- Locations for tourism & leisure
- Food & drink establishments
- Healthcare facilities
- Educational institutions
Sources: Overture Maps Foundation, Open Street Map (OSM), government departments and agencies, health insurance companies, and retailer companies. Additional data collection may be carried out in the field by us if needed.
Population and Buildings
Population data is often provided at a micro level (e.g. the number of people residing in a building) and is disaggregated from district, municipality, or census population data. This disaggregation process also takes into account land-use information to improve the accuracy of results.
Features:
- Population at a building level - District & municipality resident counts (Germany)
- Population at a local level - Census 2022 (Germany)
- Population at a European NUTS-3 level (Nomenclature of Territorial Units for Statistics)
Sources: Population data is fetched from various sources including the German Zensus 2022, and individual municipalities and districts, while building data is fetched in the form of 3D City Models from German federal states.
Administrative Boundaries
Areas under the jurisdiction of governmental or administrative entities.
Features:
- Municipalities
- Districts
- Federal states
- Postal code regions
Sources: The Federal Agency for Cartography and Geodesy (BKG) and Open Street Map (OSM).
Network Datasets for Routing
These are the networks used by GOAT's accessibility indicators for performing routing-based analyses.
While in-built networks are currently used for public transport and street routing, users will eventually be able to upload their own networks for routing-based analyses. If this feature is of interest to you, feel free to contact us.
Public Transport Network
Extensive public transport network data for various modes such as buses, trams, subways, trains, ferries, and more. This is used by GOAT for Public Transport routing.

Features:
- Stops (name, location, type, accessibility information)
- Routes (name, service type, accessibility information)
- Trips (stops served, departure timings)
- Schedules (days of operation, service frequency)
- Transfers & Levels (interchange specifications, station topology)
- Shapes (geospatial representation of routes)
Sources: DELFI for all public transport networks in Germany and Open Street Map (OSM) for street-level information which enables multi-modal routing, connections, and access/egress information for stations.
Preparation:
- Data is fetched in the GTFS (General Transit Feed Specification) format.
- Stops are verified and corrected to ensure accurate parent station and platform relationships.
- Routes are verified and corrected to ensure accurate service type and mode information.
- The network is optimized to only include the modal pattern of service for each route (the most prevalent sequence of trips).
- GOAT allows public transport analysis for three day-of-week types (Weekday, Saturday, and Sunday) with a Tuesday typically used as a reference day for the Weekday type.
Street Network and Topography
Extensive street network data that represents real-world transport networks and their components: roads, motorways, interchanges, dedicated paths, and more. This is used by GOAT for Walk, Bicycle, Pedelec, and Car routing.

Features:
- Segments or Edges (any continuous path not bisected by another)
- Connectors or Nodes (any point where two distinct paths intersect)
Sources: Overture Maps Foundation for Europe-wide street network data and Digital Elevation Model (DEM) tiles which capture crucial topography (surface gradient) information from Copernicus.
Preparation:
- Data is fetched in the Geoparquet format from Overture Maps' Transportation theme.
- Digital Elevation Model (DEM) tiles for the European region are fetched and processed.
- Segments and connectors of the street network are processed and spatially indexed according to Uber's H3 grid-based solution.
- Surface and slope impedance are computed for each segment using topography data from the DEM tiles.
- Various attributes of each segment are parsed to identify street class, turning & one-way restrictions, and speed limits.
- The modal speed limit per street class is used to interpolate speed limits for segments where this is undefined.