Basic styling
Layer styling allows you to customize the visual appearance of your data to create clear, appealing maps. GOAT automatically assigns default styles based on your data type (points, lines, or polygons), but you can customize colors, strokes, opacity, and other visual properties.
How to style your layers
Layer design  and find the
 Style sectionFill color, Stroke color, Stroke width, Custom Marker and Point settings (if point data).Fill color
Fill color defines the interior appearance of point and polygon features.
On Color use the Color picker to select your color or the Preset colors to choose from the predefined color palette.
opacity slider or enter a value between 0 (transparent) and 1 (opaque) to control transparency.Stroke color
Stroke color applies to the outlines and edges of map features. It helps distinguish features and enhance their visibility.
Color use the Color picker or the Preset colors to customize stroke appearance.Stroke width
Stroke width move the slider to adjust the thickness of lines and feature outlines.Custom markers
For point layers, you can use custom markers instead of basic shapes.
Custom Marker toggle to enable custom markersSelect Marker and browse the icon library or upload your own marker by clicking on the Custom tab and uploading your file (JPEG, PNG, or SVG format).Manage icons to rename or delete uploaded iconsSize adjust the marker size using the slider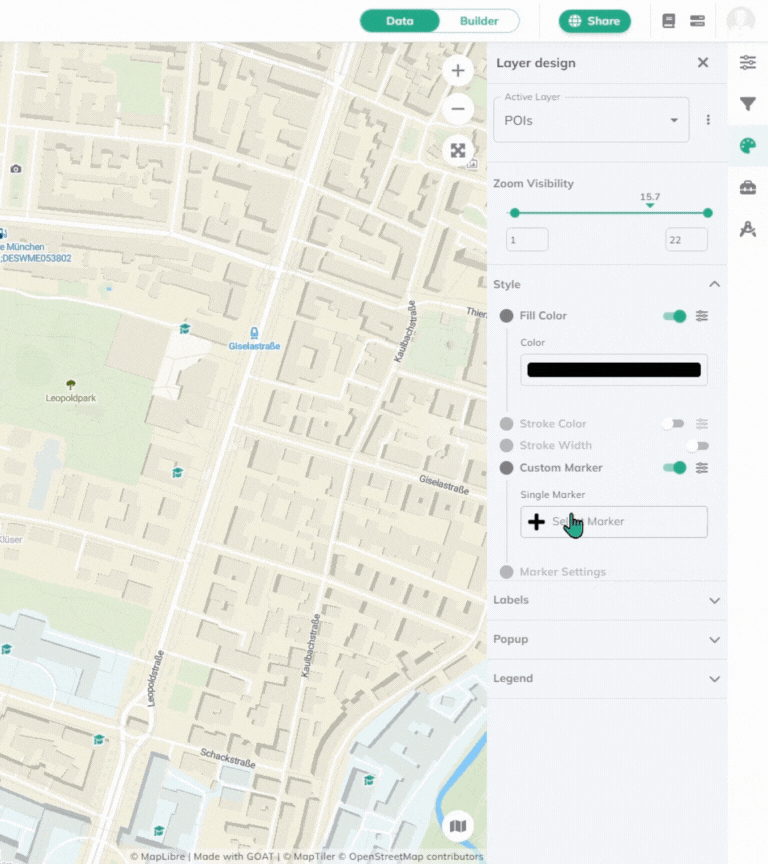
You can only edit the color of icons from the library, not uploaded custom icons.
Point settings
Point settings, on Size adjust the radius using the slider or enter precise values in the text box for exact control.Default settings
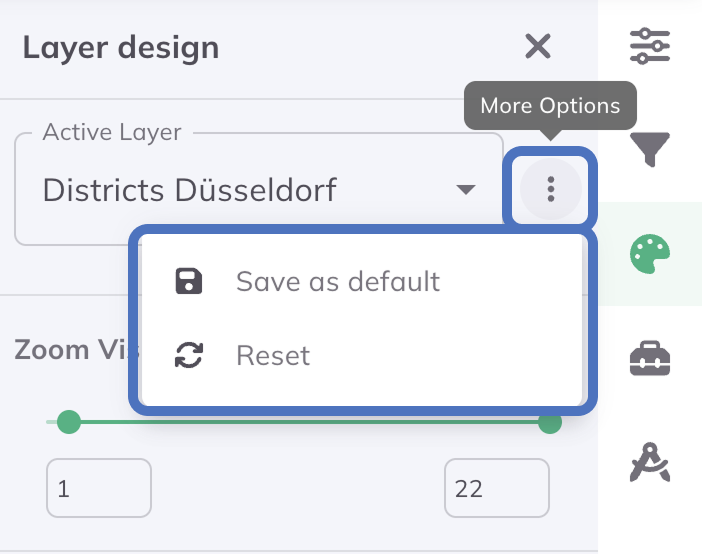
When you have created a style you like, you can save it as the default for future uses of this dataset, so whenever you copy or re-add the dataset, your custom styles are applied automatically.
More options  next to
 Active layer Choose your action:
Save as default- Apply current styles to future uses of this datasetReset- Return to original default styles
Explore attribute-based styling for advanced visualization options based on your data values.