Workflow Interface
Workflows in GOAT provide a powerful visual automation system for creating sophisticated spatial analysis pipelines. Instead of running individual tools sequentially, you can connect multiple analysis steps together using a drag-and-drop canvas, creating an automated data processing that eliminates repetitive manual work.
The workflows can be reused across different datasets and scenarios. Each workflow consists of different types of nodes connected by edges, enabling you to:
- Automate complex analytical pipelines: Chain multiple tools together where the output of one analysis automatically feeds into the next
- Create multi-source data workflows: Build sophisticated analysis processes that integrate multiple datasets and processing steps
- Document automated processes: Add text annotations to explain methodology and analytical decisions
- Execute with flexible automation: Run individual nodes, execute workflow segments, or automate entire pipelines
- Build reusable automation templates: Store workflows within projects for repeatability across different scenarios
- Leverage advanced automation features: Use workflow variables and custom SQL for sophisticated parameterized analysis
The visual canvas interface makes complex spatial analysis automation accessible to users at all technical levels while maintaining full documentation of the analytical process for reproducibility and collaboration.
1. Interface Components
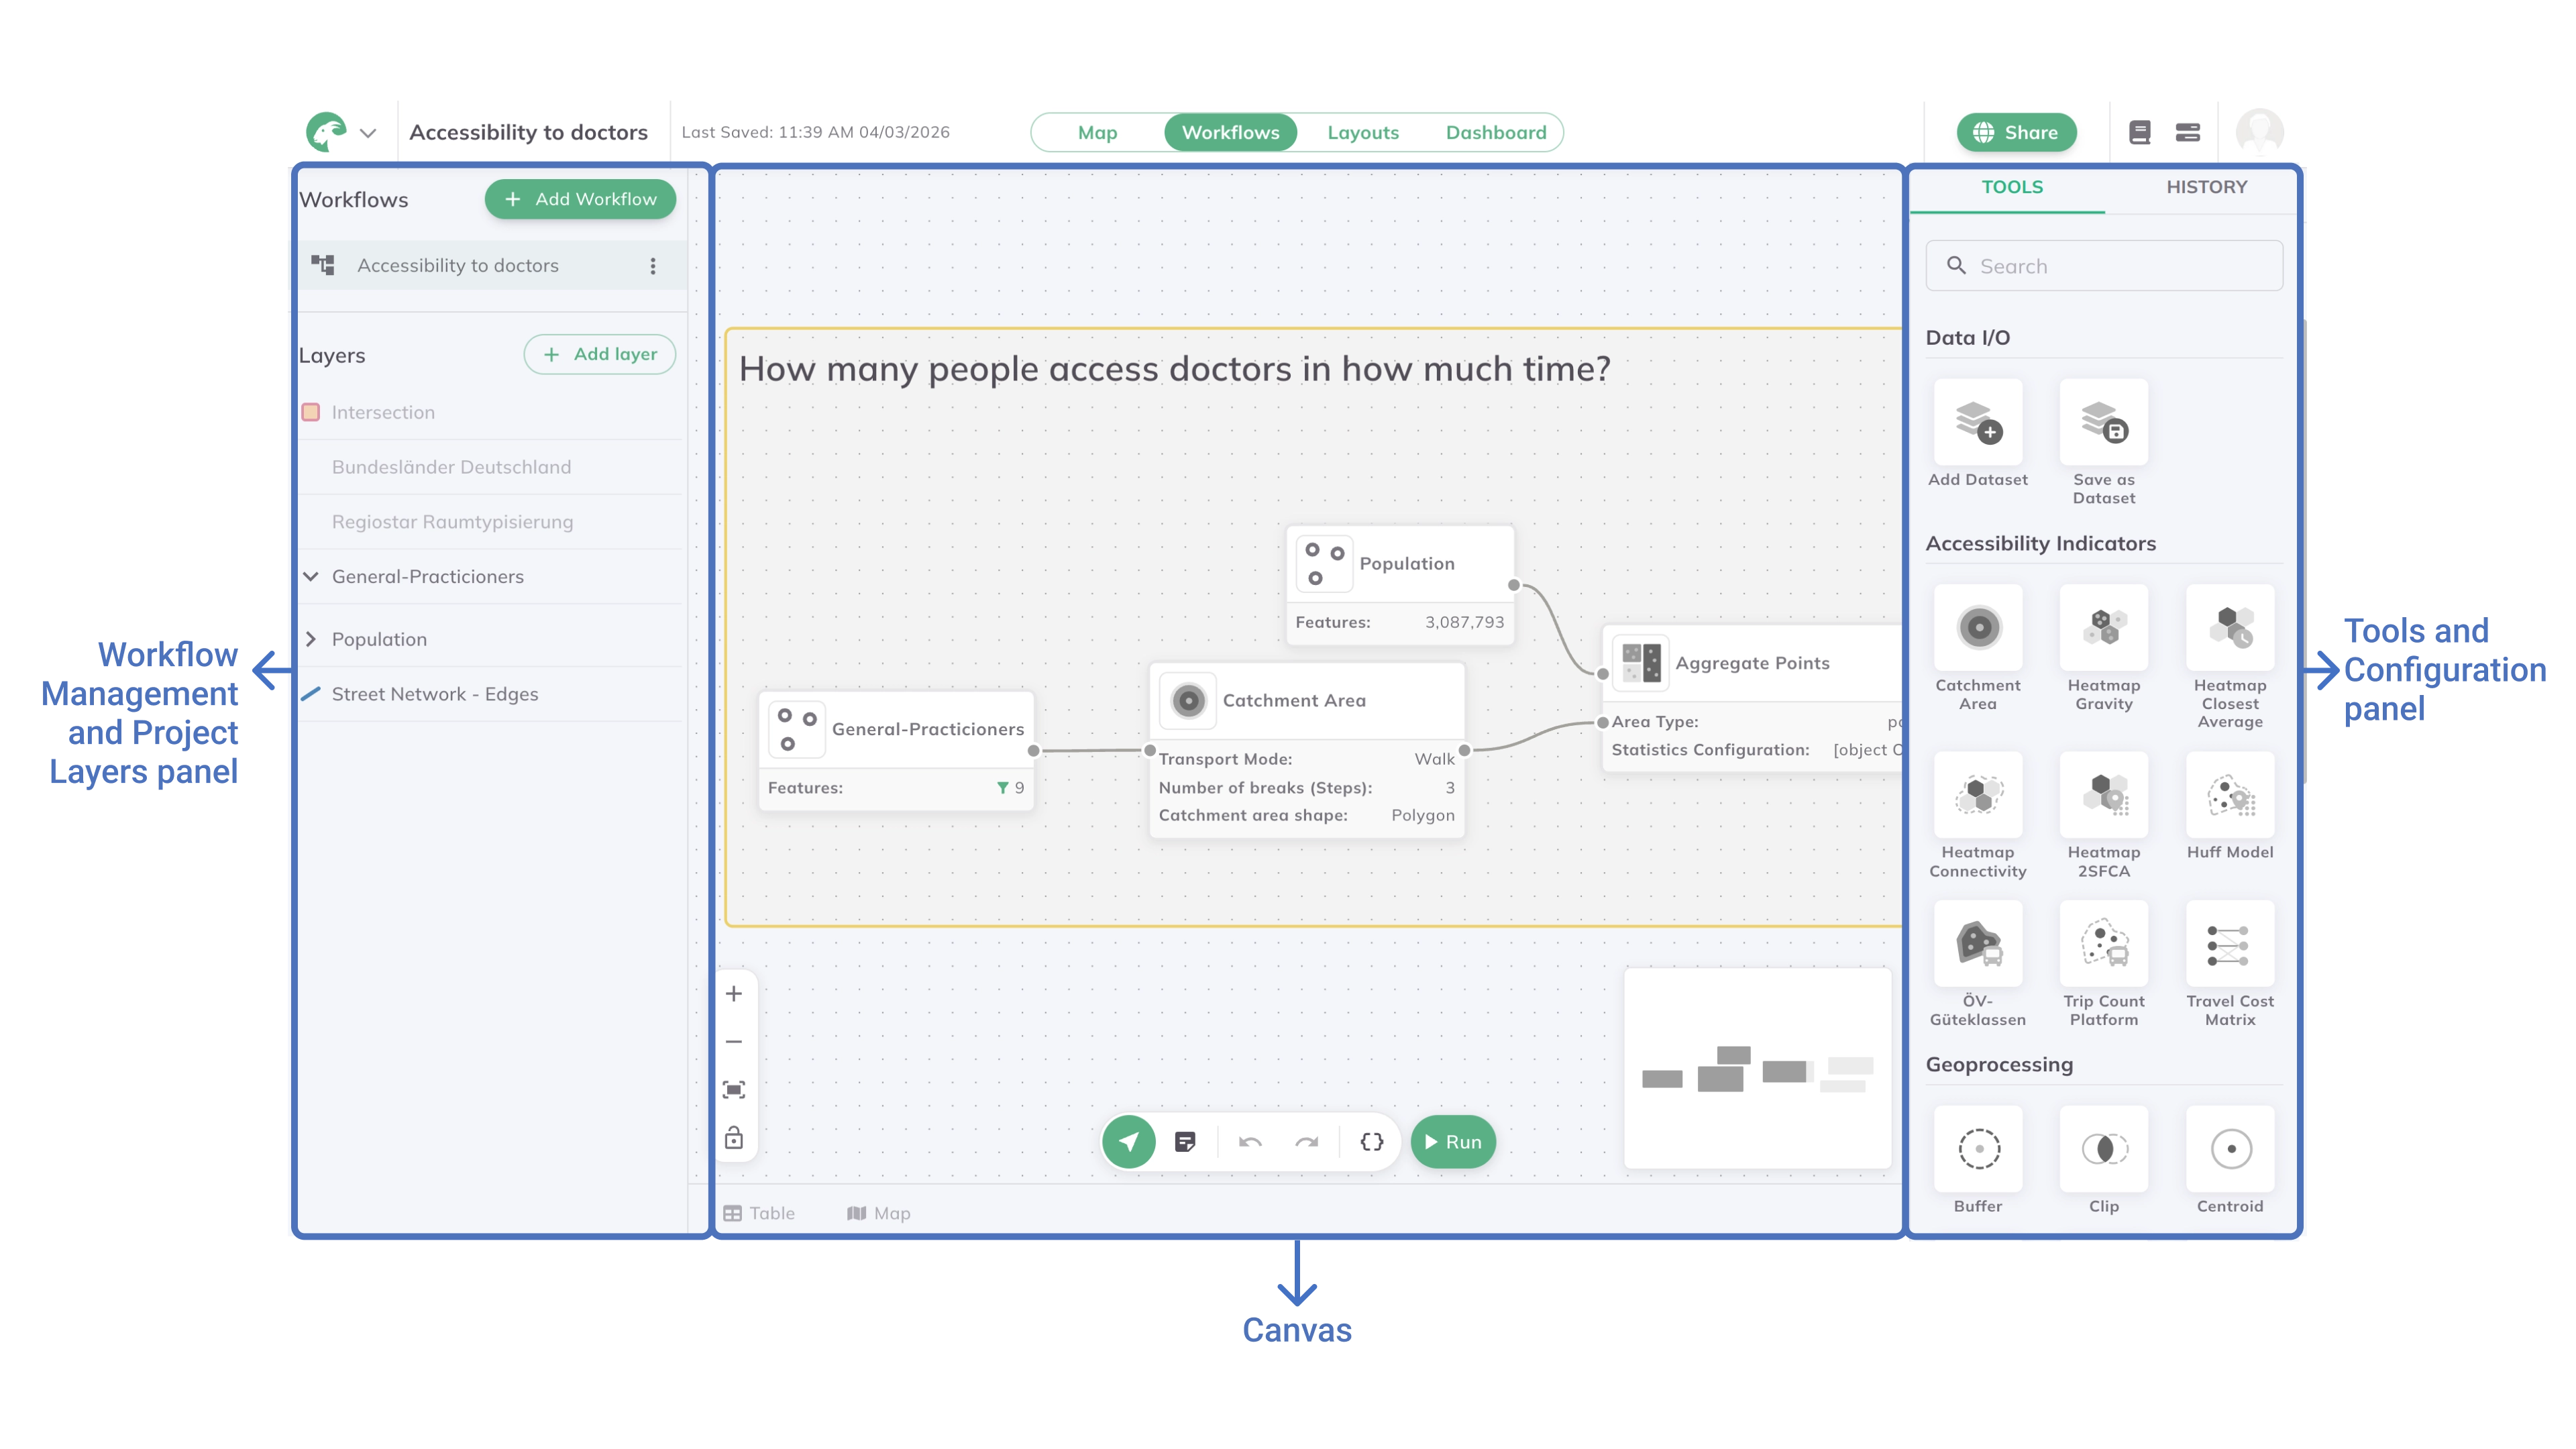
The workflow interface consists of two main panels and the workflow canvas, providing an intuitive workspace for visual workflow construction.
Workflow Management and Project Layers panel
This panel is located on the left and it is divided into two sections:
Workflows Management
Add Workflow: Click
+ Add Workflowto create new analytical pipelinesWorkflow List: Manage existing workflows with options to rename, duplicate, and delete
Project Layers
Layer Tree: Read-only display of project's data layers. You can drag and drop them onto the canvas to build the workflow.
Add a Layer: Add new layers to the project to use them in the workflow and map mode.
Workflow Canvas
Canvas Workspace
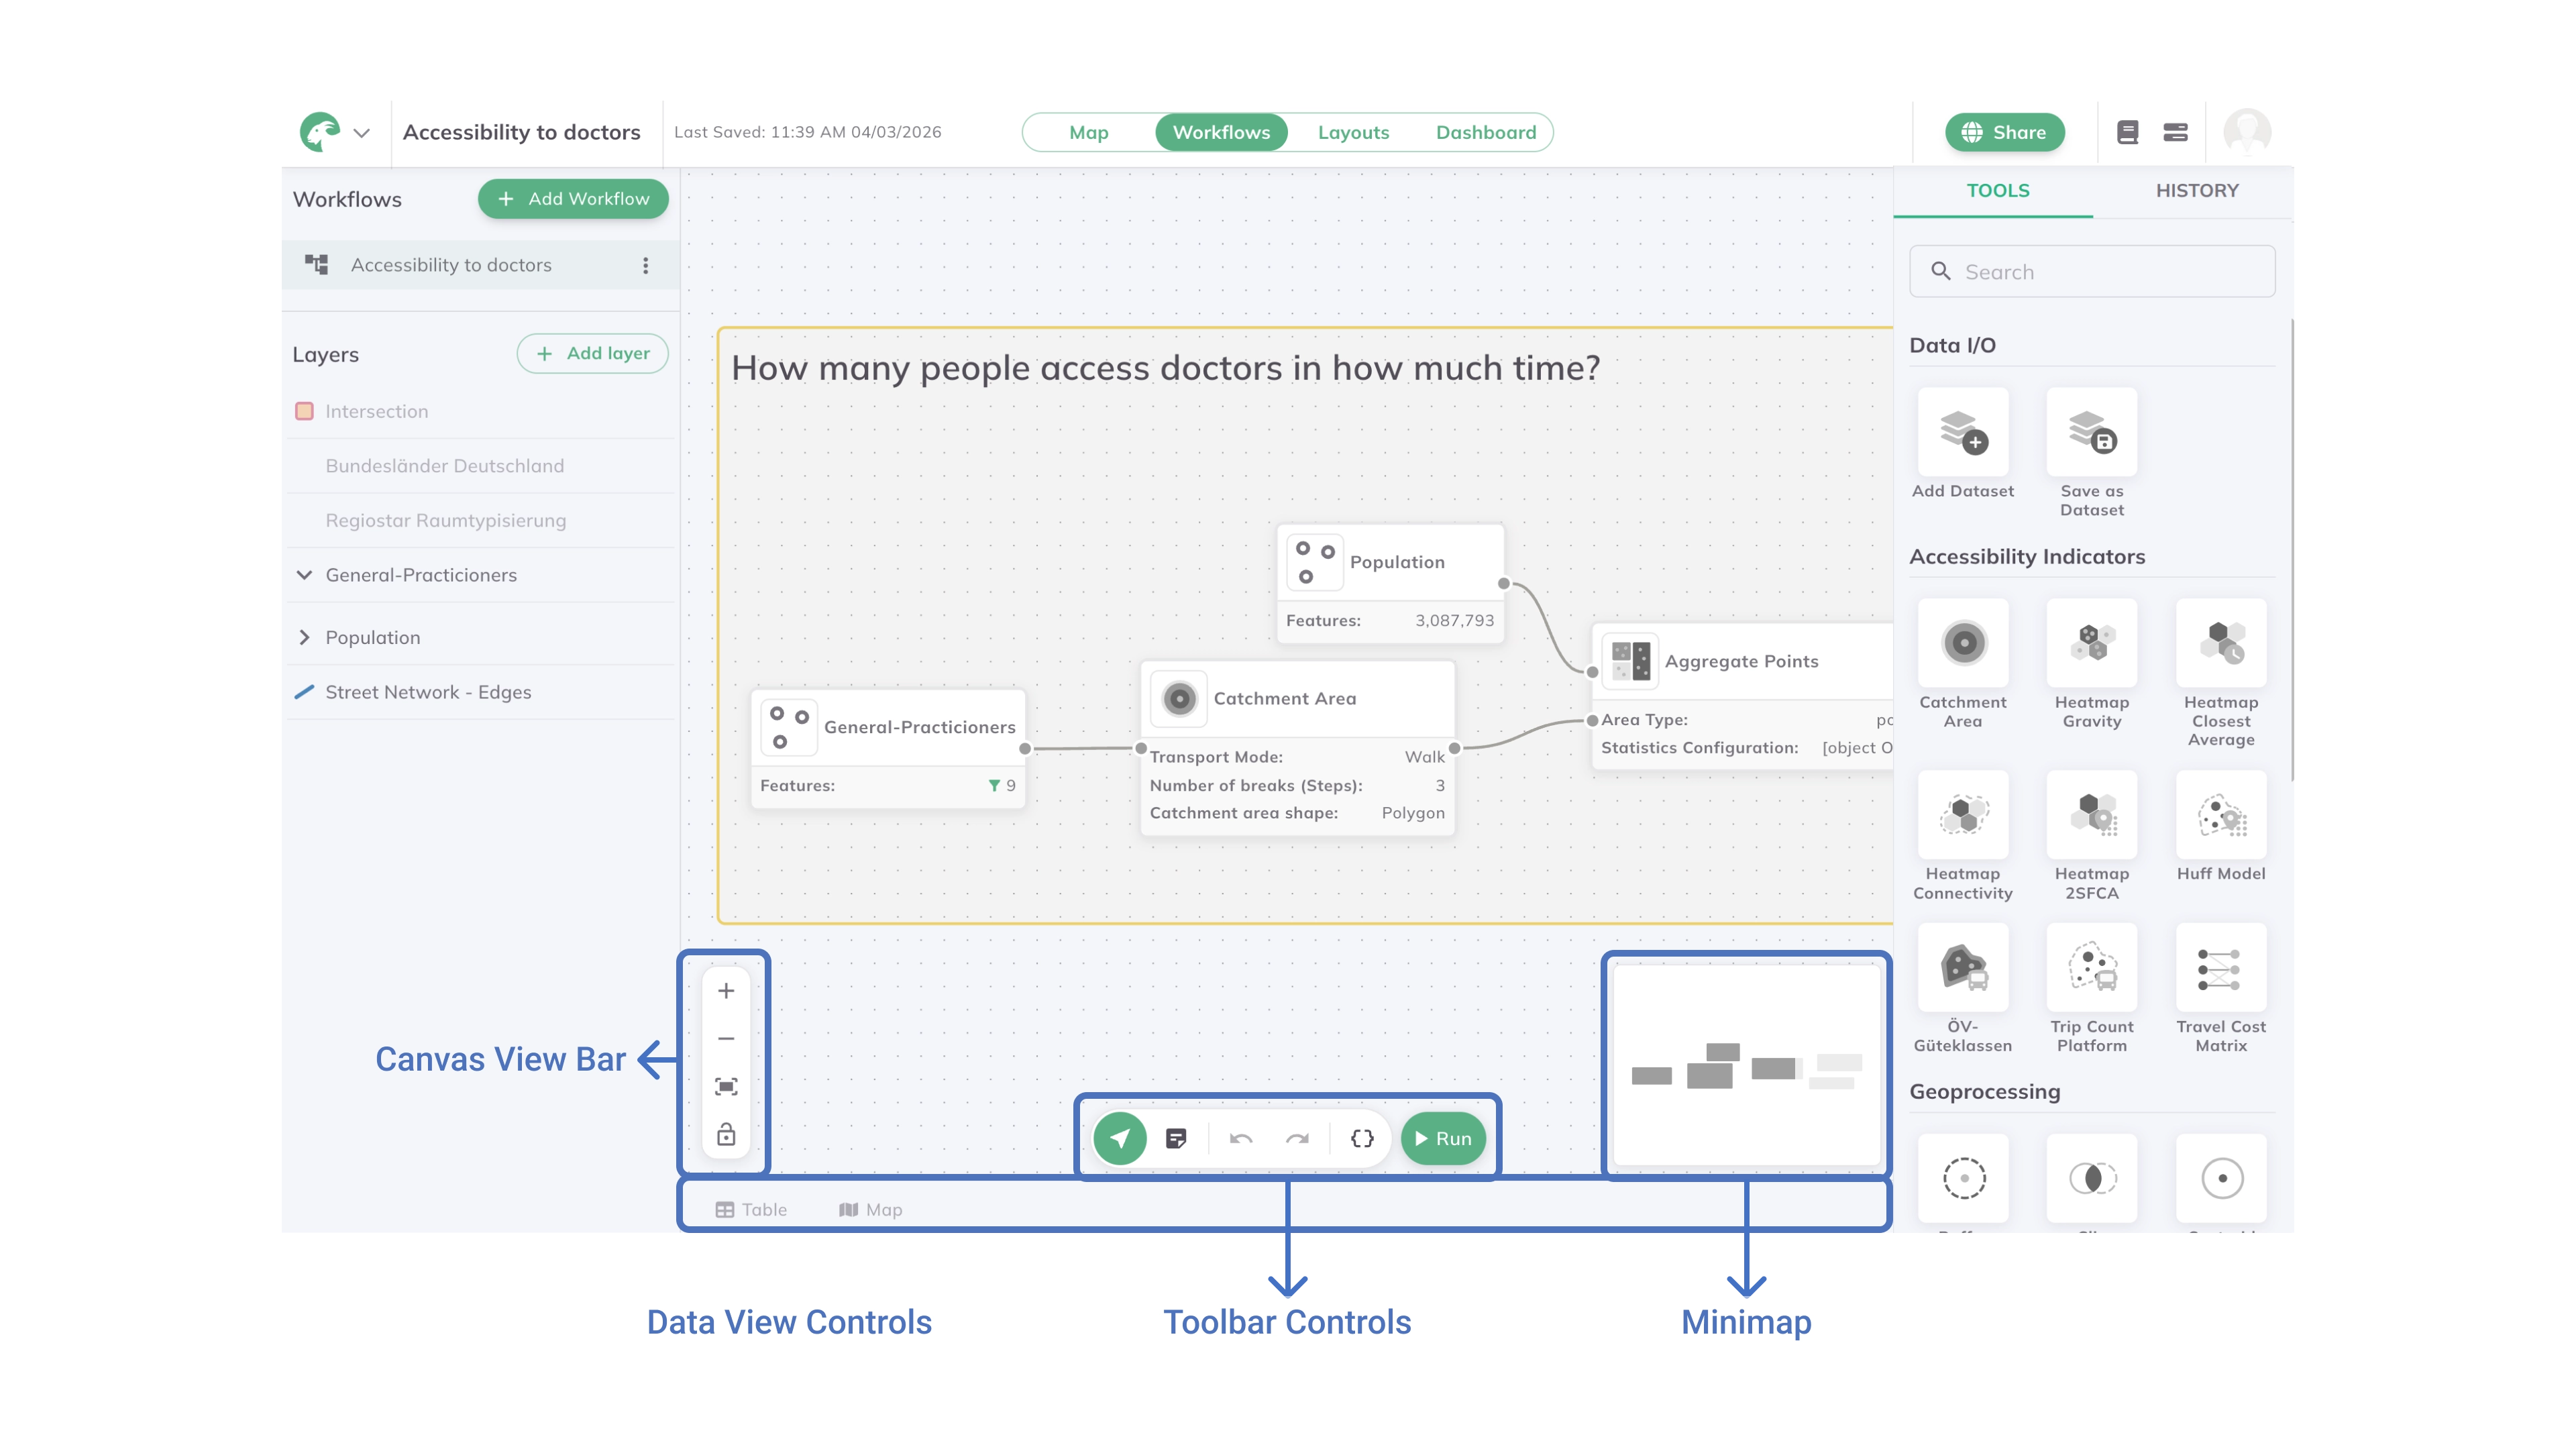
The canvas workspace is where you can drag and drop nodes, zoom, pan, and select elements. It contains several control areas:
Canvas View Bar: Located in the bottom left corner of the canvas:

Zoom In: Increase the canvas magnification for detailed work
Zoom Out: Decrease the canvas magnification to see more of the workflow
Fit View: Adjust the view to display the entire workflow at once
Lock View: Prevent accidental panning and zooming of the canvas
Toolbar Controls: Located at the middle bottom of the canvas:

Select: Default cursor for selecting and moving nodes
Text Card: Add text annotations to document workflow steps
Redo: Restore the last undone action
Undo: Reverse the last action
Variables: Create and manage workflow variables for reusable parameters
Run: Execute the entire workflow
Minimap: Located in the bottom right corner of the canvas, providing an overview navigator for complex workflows.
Data View Controls: Located at the bottom of the canvas. Select a node to activate the panel — it shows the data of that node's layer:
Table: Opens the attribute table of the selected node's layerMap: Opens a map preview of the selected node's layer (only available if the layer has geometry)
Tools and Configuration panel
The right panel changes depending if there is a node selected or not. If no node is selected then the Tools and History panel will be visible. If a tool node is selected, the Configuration panel will appear, and if a dataset node is selected the Dataset panel will appear.
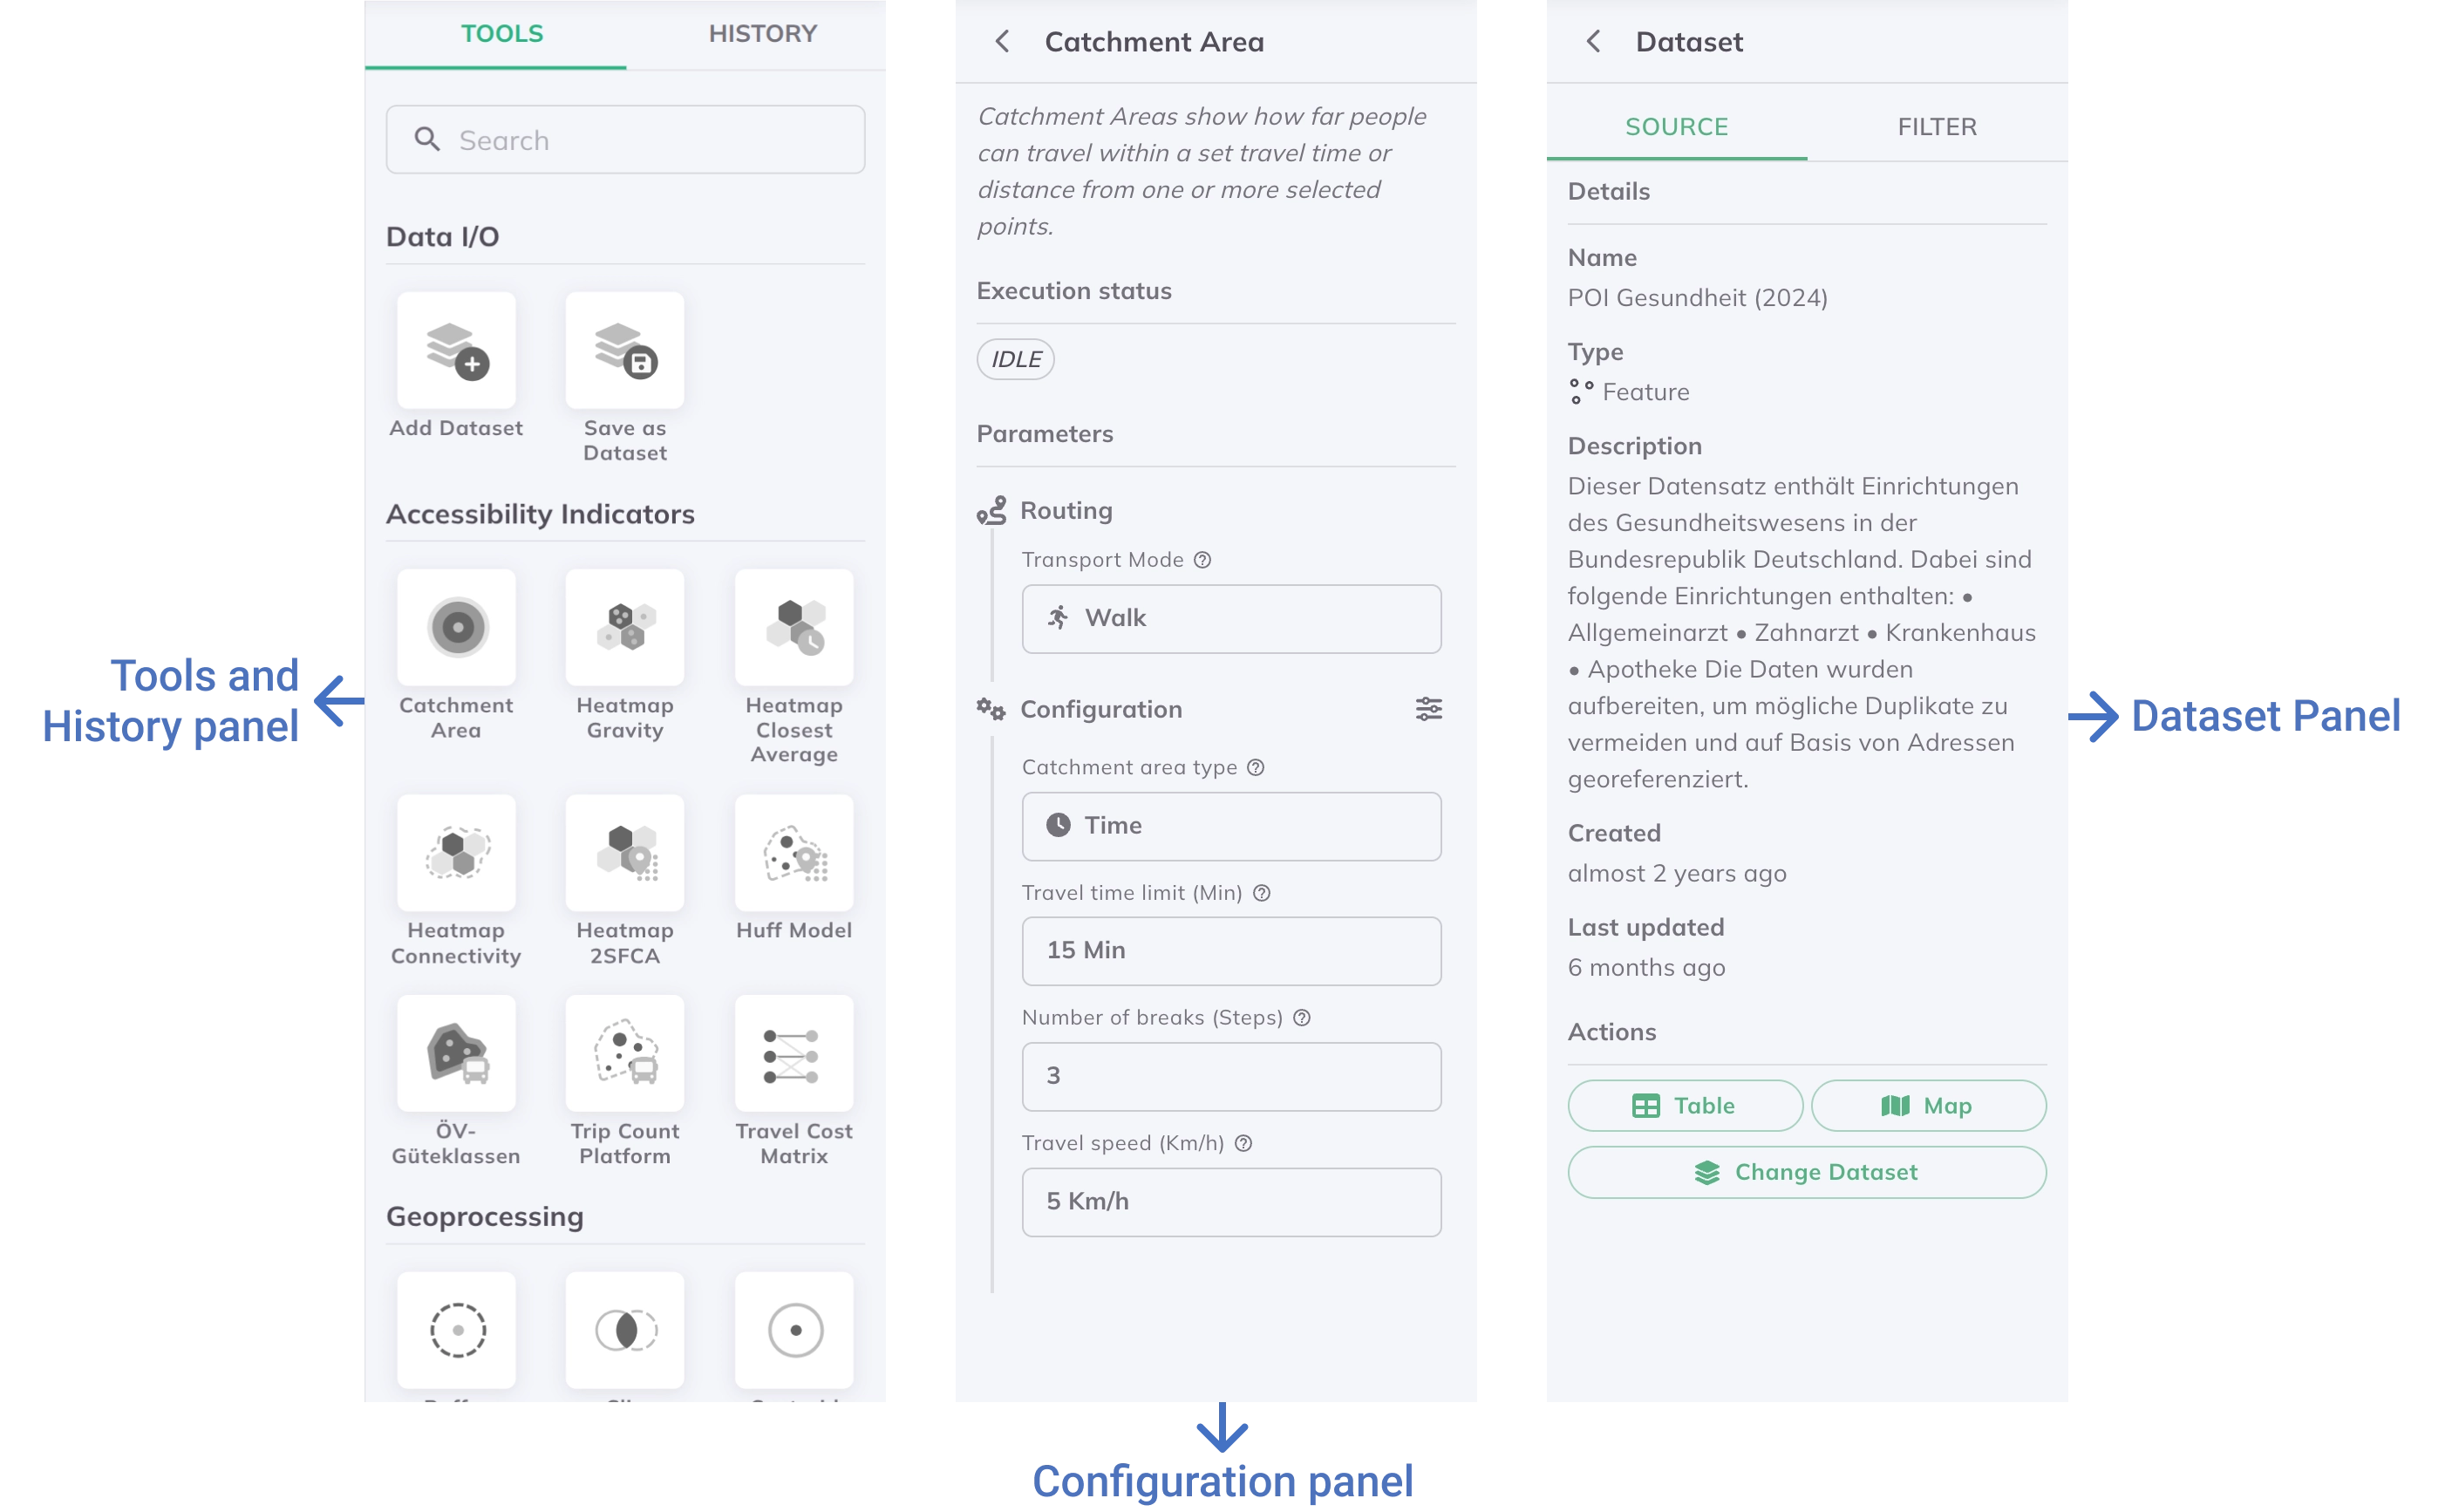
Tools and History panel
Tools Tab
This tab contains categorized tools available for workflow construction, similar to the Map Mode Toolbox. Drag and drop tools onto the canvas to add them to your workflow. The tools are organized into the following categories:
- Data I/O
+ Add Dataset: Create dataset nodesSave as Dataset: Save workflow results as permanent datasets. Configure the **Dataset name**, toggle **Add to project** to automatically add the result to the project layer list, and enable **Overwrite on re-run** to replace the previously exported dataset each time the workflow runs instead of creating a new one.
Give each Save as Dataset node a descriptive name and enable Overwrite on re-run when running the same workflow repeatedly — this keeps your project clean by avoiding duplicate layers after each run.
Accessibility Indicators
- All tools available in the Accessibility Indicators section of the Toolbox
Geoanalysis
- All tools available in the Geoanalysis section of the Toolbox
Geoprocessing
- All tools available in the Geoprocessing section of the Toolbox
Data Management
- Join, Merge, and other data manipulation tools
- Custom SQL: Advanced data processing with SQL queries
Control
Conditional: Add a branching node that routes the layer to a True or False path based on defined conditions. See Conditional.
History Tab Here you can see:
- Execution Log: Previous workflow runs with timestamps and status
- Execution Details: Duration, success/failure status, and error messages
- Result Access: Links to previous workflow outputs
Configuration Panel (Tool Node Selected)
When a tool node is selected, the right panel displays the Tool Configuration panel. Configure all tool-specific parameters for the selected analysis. You can also use workflow variables within parameter fields for dynamic values.
Dataset Panel (Dataset Node Selected)
When a dataset node is selected, the dataset panel appears with two available tabs:
Source Tab: View metadata from the data source and access table and map views. You can also change the dataset assigned to the node from this tab.
Filter Tab: Apply filters specific to the workflow without affecting the original layer.
2. Example use cases
- Accessibility Analysis Pipeline: Create catchment areas, intersect with population data, calculate accessibility indicators, and export results
- Site Suitability Assessment: Buffer constraints, perform spatial overlays, apply weighting factors, and rank suitable locations
- Multi-Source Data Integration: Join multiple datasets, apply spatial filters, aggregate statistics, and create comprehensive analytical outputs
- Quality Assessment Workflow: Validate data quality, check spatial relationships, generate validation reports using Custom SQL
- Comparative Scenario Analysis: Use workflow variables to run identical analyses with different parameters or datasets
3. How to use the workflow interface
Begin with simple 2-3 node workflows to understand the interface, then gradually build more complex analytical pipelines as you become comfortable with the system.
Creating Your First Workflow
Workflows tab in GOAT's main navigation to access the workflow interface.+ Add Workflow in the left panel to create a new workflow.Building Your Workflow
+ Add Dataset from the right panel's Tools tab onto the canvas, or by dragging layers directly from the Project Layers panel on the left. Configure the dataset node to reference your input data layers.Executing and Managing Workflows
Run Workflow option to execute the entire workflow from start to finish.Table and Map buttons at the bottom of the canvas to inspect the selected node's results once the workflow completes.Results
Successfully using the workflow interface provides:
- Reproducible Analysis: Documented analytical processes that can be rerun with different data or parameters
- Efficient Workflow: Streamlined multi-step analysis execution with automatic dependency management
- Quality Control: Validation capabilities at each step of complex analytical pipelines
- Collaborative Documentation: Visual representation of methodology for team sharing and knowledge transfer
- Advanced Capabilities: Access to specialized tools like Custom SQL and workflow variables for sophisticated analysis
Workflows automatically save changes as you build them. The system preserves all configurations, connections, and execution states.
4. Running workflows from the Map view
Workflows can also be run directly from the Map view without opening the workflow editor. Open the Toolbox, click the Workflows tab, and select a workflow from the list. If the workflow has variables, a Variables section appears where you can set values before running.