Catchment Area
Catchment Area shows how far people can travel within a certain travel time or distance, using one or more transport modes — with extended output shapes, custom step sizes, and additional public transport settings.
1. Explanation
Based on specified starting point(s), maximum travel time or distance, and transport mode(s), Catchment Areas visualize accessibility extent using real-world data. This provides insights into transport network quality, density, and extensiveness. The catchment area can be intersected with spatial datasets, such as population data, to assess reachable amenities and identify accessibility coverage for inhabitants.
Catchment Area includes the following additional features:
For all routing modes:
- Custom step sizes — define each isochrone step independently (e.g., 5, 10, 20, 30 minutes) instead of using equally-spaced intervals.
- Point Grid output shape — a new result geometry option that represents the catchment as a grid of individual points, each showing its exact travel cost value.
For Public Transport only:
- Maximum number of transfers — limit how many PT connections a trip can include.
- Access and egress mode — configure how users travel to and from PT stations (walking, cycling, or car).
Catchment Area computation is available in specific regions.
When selecting a Routing type, GOAT displays a map overlay showing coverage.
For Walk, Bicycle, Pedelec, and Car: over 30 European countries are supported.
For Public Transport: Germany, Switzerland, and the Haut-Rhin region of France are supported.
If you need analyses beyond these regions, feel free to contact us and we'll discuss further options.
2. Example use cases
- Which amenities are reachable within a 5, 10, and 20-minute walk? (Using custom step sizes to reflect planning standards.)
- How does limiting PT connections to one transfer change the catchment area compared to unlimited transfers?
- Which areas are reachable by bicycle within 5 minutes, 15 minutes, and 30 minutes from a new cycling hub?
- How do workplace catchment areas compare between car and public transport when cyclists can access PT stations?
- What share of the population has a general practitioner within 500m on foot?
3. How to use the tool?
Toolbox  . Under
 Accessibility Indicators, click on Catchment Area.Routing & Configuration
Routing Type and configure the parameters for your chosen mode following the steps below.- Walk / Bicycle / Pedelec / Car
- Public Transport (PT)
Time or Distance, and set the corresponding limit. If choosing Time, you can also configure the Speed.For suitable travel time limits by amenity type, see the Location Tool from the City of Chemnitz.
Catchment area shape. If choosing: PolygonorNetwork: you can select theStepsandStep sizes.Hexagonal grid: no further configuration is necessary.Point grid: you need to select thePoint grid layerwhere the values will be applied.
Considers all locations accessible by public transport, including inter-modal transfers and station access.
Public transport modes to analyze: Bus, Tram, Rail, Subway, Ferry, Cable Car, Gondola, and/or Funicular, and configure the Travel time limit in minutes.For suitable travel time limits by amenity type, see the Location Tool from the City of Chemnitz.
Catchment area shape. If choosing: PolygonorNetwork: you can select theStepsandStep sizes.Hexagonal grid: no further configuration is necessary.Point grid: you need to select thePoint grid layerwhere the values will be applied.
Day, Start Time, and End Time for the analysis time window.Advanced Options
- Walk / Bicycle / Pedelec / Car
- Public Transport (PT)
Advanced Options to configure additional settings.Shape style
(Walk, Bicycle, and Pedelec only — visible when Catchment area shape is set to Polygon)
Choose how polygons are shaped when there are multiple starting points:
- Combined across origins (default) — all starting points are merged into a single shared catchment polygon per step.
- Separated by origin — each starting point gets its own individual catchment polygon per step.
Steps style
Choose how the isochrone steps are displayed:
- Separated steps — each step shows only the area reachable between that step and the previous one.
- Cumulative steps — each step shows the full area reachable up to that travel cost.
Advanced Options to configure the Steps style, Maximum Transfers, Access mode, and Egress mode.Steps style
Choose how the isochrone steps are displayed:
- Separate steps — each step shows only the area reachable between that step and the previous one.
- Cumulative steps — each step shows the full area reachable up to that travel cost.
Maximum Transfers
Set the Maximum transfers to limit how many PT connections are allowed per trip. For example, setting it to 1 means only trips with at most one transfer are included — direct connections and one-change journeys.
Access & Egress Mode
Configure how users travel to and from PT stations:
- Access mode — Transport mode to reach the PT station (Walk, Bicycle, Pedelec, Car).
- Egress mode — Transport mode from the PT station to the destination (Walk, Bicycle, Pedelec, Car).
For each mode, configure the maximum travel time or distance and the travel speed. For example, you can model a cyclist who rides at 15 km/h for up to 10 minutes to reach a train station.
Starting Points
Starting point method: Select on map and click on the map to place starting point(s). Or Select from layer and choose a Point layer containing your desired starting point(s). All features in the layer will be used as starting points.Result Layer
Result layer name for the output catchment area layer.Starting points layer name for the output starting points layer.Run to start the calculation.Calculation time varies by settings. Check the status bar for progress.
Results
Once the calculation finishes, the resulting layer(s) are added to the map:
- Catchment Area — the calculated isochrones in the selected shape (polygon, network, hexagonal grid, or point grid). Click any feature to inspect the travel_cost attribute, which shows travel time (minutes) or distance (meters) depending on your configuration.
- Starting Points — a point layer with the selected starting locations (only created when starting points were placed on the map, not when using a pre-existing layer).
The result layer is automatically styled with a color scale ranging from the shortest to the longest travel cost step.
4. Technical details
Catchment areas are isolines connecting points reachable from starting point(s) within a time interval (isochrones) or distance (isodistance). The calculation uses the appropriate transport network for the selected routing mode.
Starting point limits
| Routing mode | Maximum starting points |
|---|---|
| Walk / Bicycle / Pedelec / Car | 1,000 |
| Public Transport | 100 |
Visualization
The algorithm used to derive the catchment shape depends on the routing mode:
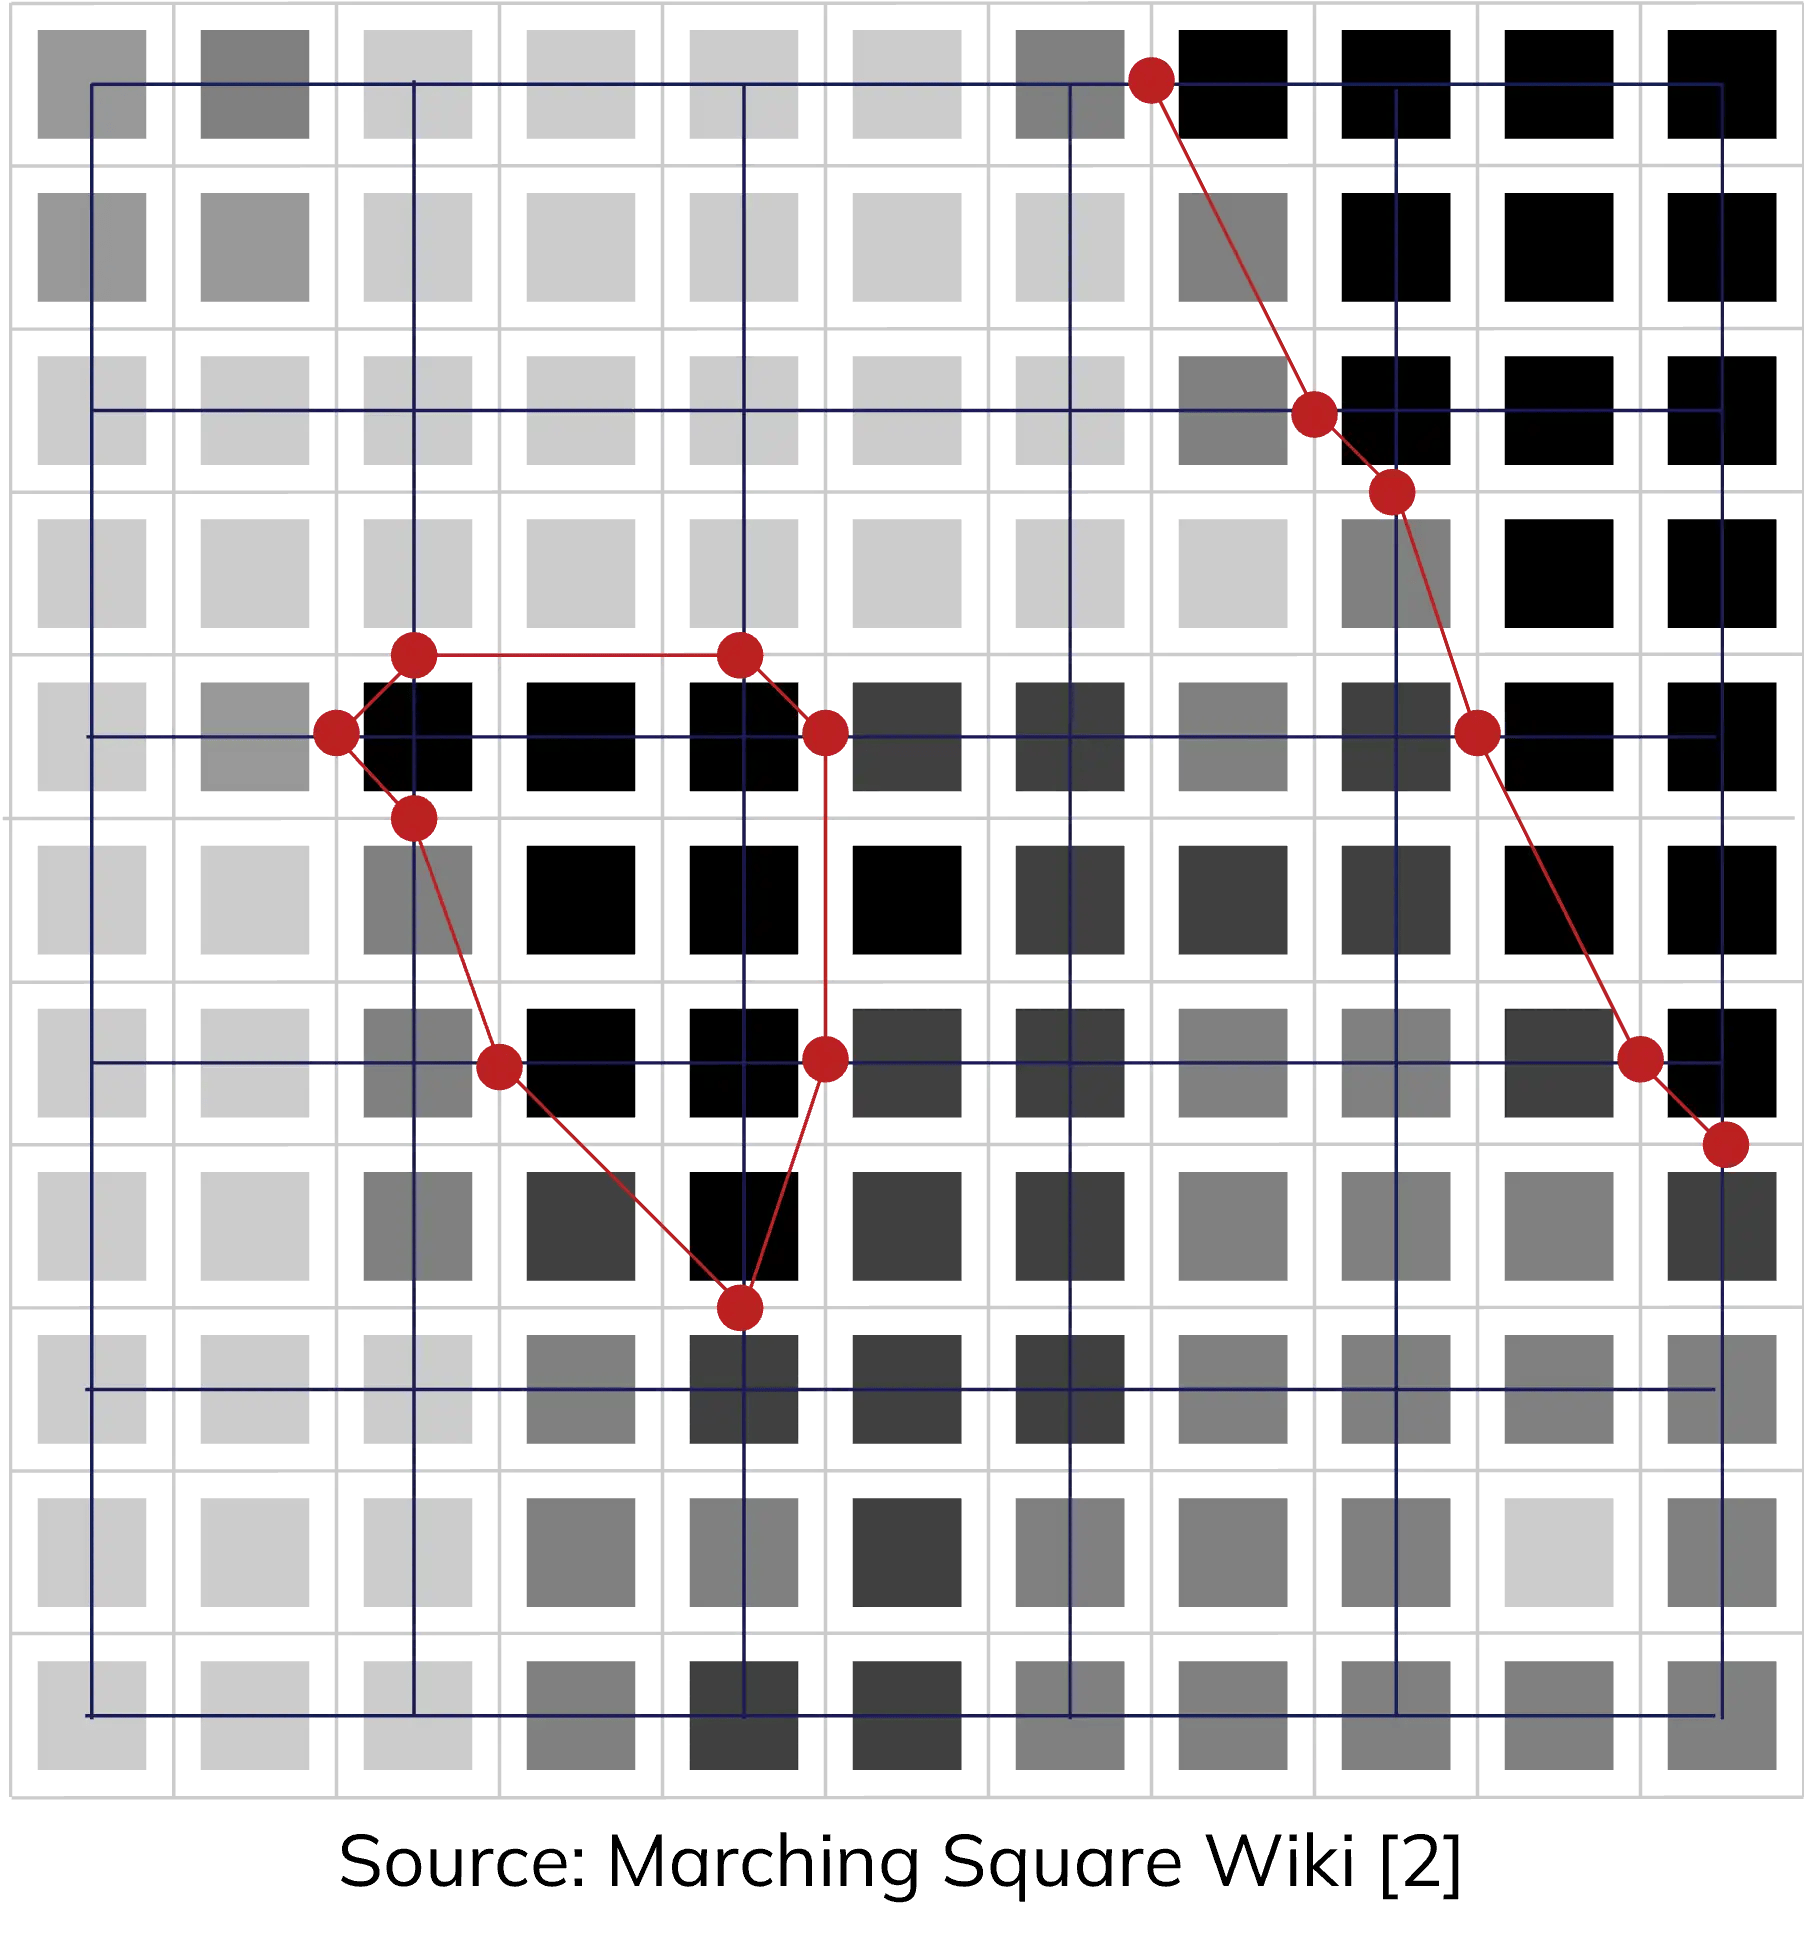
- Walk, Bicycle, Pedelec, and Public Transport — the shape is derived from the routing grid using the Marching Squares contour line algorithm, a computer graphics algorithm generating 2D contour lines from rectangular value arrays (de Queiroz Neto et al. 2016). This transforms the routing grid from a 2D array into smooth polygon contours for visualization and spatial analysis.
- Car — the shape is derived using DuckDB's
ST_ConcaveHullfunction, which wraps tightly around the set of reachable points to produce the catchment polygon. A dynamic concavity ratio is applied based on the number of reached nodes:0.5for fewer than 10,000 nodes,0.3for fewer than 50,000, and0.2otherwise — lower values produce tighter, more concave shapes for large catchments, while higher values yield smoother outlines for small ones.
Scientific background
Catchments are contour-based measures (also cumulative opportunities), valued for their interpretable results (Geurs and van Eck 2001; Albacete 2016). They do not distinguish between different travel times within the cut-off range (Bertolini, le Clercq, and Kapoen 2005), unlike heatmap-based accessibility indicators.
For further insights into the routing algorithm, visit Routing.
5. Further readings
Further insights into catchment calculation and scientific background: this publication.
6. References
Albacete, Xavier. 2016. "Evaluation and Improvements of Contour-Based Accessibility Measures." url: https://dspace.uef.fi/bitstream/handle/123456789/16857/urn_isbn_978-952-61-2103-1.pdf
Bertolini, Luca, F. le Clercq, and L. Kapoen. 2005. "Sustainable Accessibility: A Conceptual Framework to Integrate Transport and Land Use Plan-Making." Transport Policy 12 (3): 207–20. https://doi.org/10.1016/j.tranpol.2005.01.006
J. F. de Queiroz Neto, E. M. d. Santos, and C. A. Vidal. "MSKDE - Using Marching Squares to Quickly Make High Quality Crime Hotspot Maps". en. In: 2016 29th SIBGRAPI Conference on Graphics, Patterns and Images (SIBGRAPI). Sao Paulo, Brazil: IEEE, Oct. 2016, pp. 305–312. isbn: 978-1-5090-3568-7. doi: 10.1109/SIBGRAPI.2016.049. url: https://ieeexplore.ieee.org/document/7813048
https://fr.wikipedia.org/wiki/Marching_squares#/media/Fichier:Marching_Squares_Isoline.svg
Majk Shkurti, "Spatio-temporal public transport accessibility analysis and benchmarking in an interactive WebGIS", Sep 2022. url: https://www.researchgate.net/publication/365790691_Spatio-temporal_public_transport_accessibility_analysis_and_benchmarking_in_an_interactive_WebGIS
Matthew Wigginton Conway, Andrew Byrd, Marco Van Der Linden. "Evidence-Based Transit and Land Use Sketch Planning Using Interactive Accessibility Methods on Combined Schedule and Headway-Based Networks", 2017. url: https://journals.sagepub.com/doi/10.3141/2653-06
Geurs, Karst T., and Ritsema van Eck. 2001. "Accessibility Measures: Review and Applications." RIVM Report 408505 006. url: https://rivm.openrepository.com/handle/10029/259808