Aggregate Polygons
The Aggregate Polygon tool performs statistical analysis of polygons, e.g. count, sum, min, or max, and aggregates the information on polygons.
1. Explanation
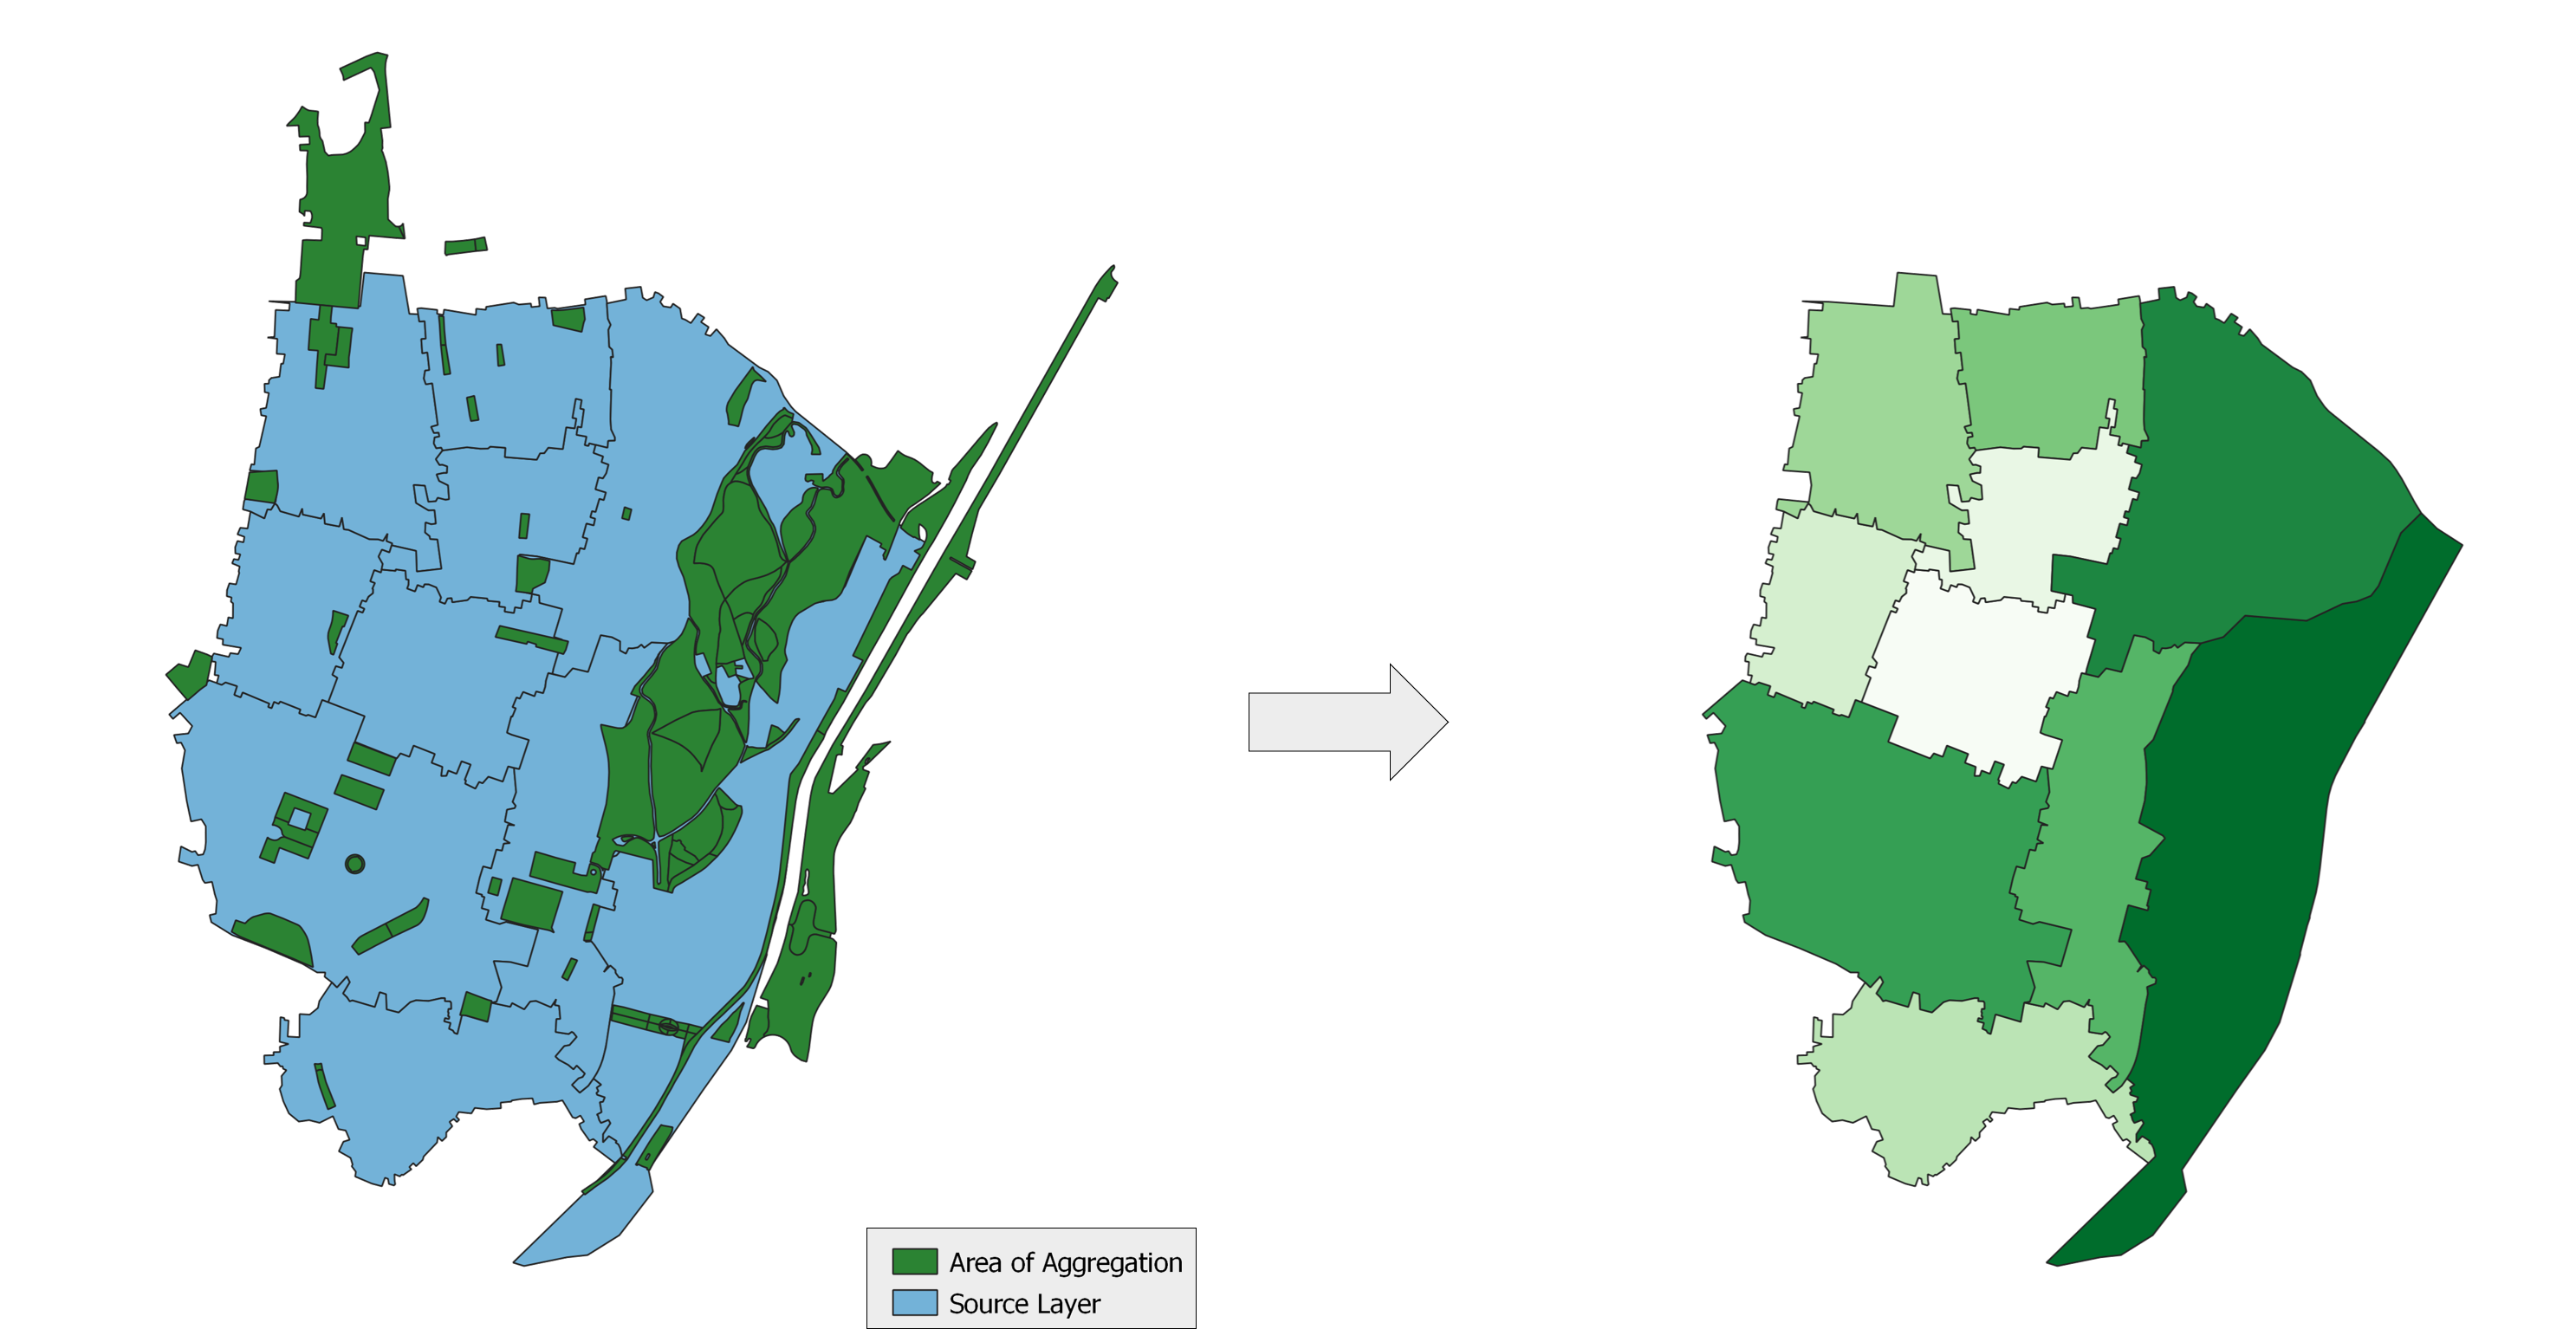
With the Aggregate Polygons tool, data can be combined or aggregated between different polygon layers based on their spatial relationships. These spatial relationships are calculated using different statistical approaches. This technique is useful for analyzing and visualizing how different geographical entities interact, making them easier to analyze and interpret.
The example below shows the geometry of the Source Layer remains the same, while its attribute table will be enriched by aggregating information from the Area of Aggregation.

2. Example use cases
- Visualizing the number of parks per city district.
- Calculating the mean building size in an area.
- Aggregating population numbers on a hexagonal grid and calculating population densities.
3. How to use the tool?
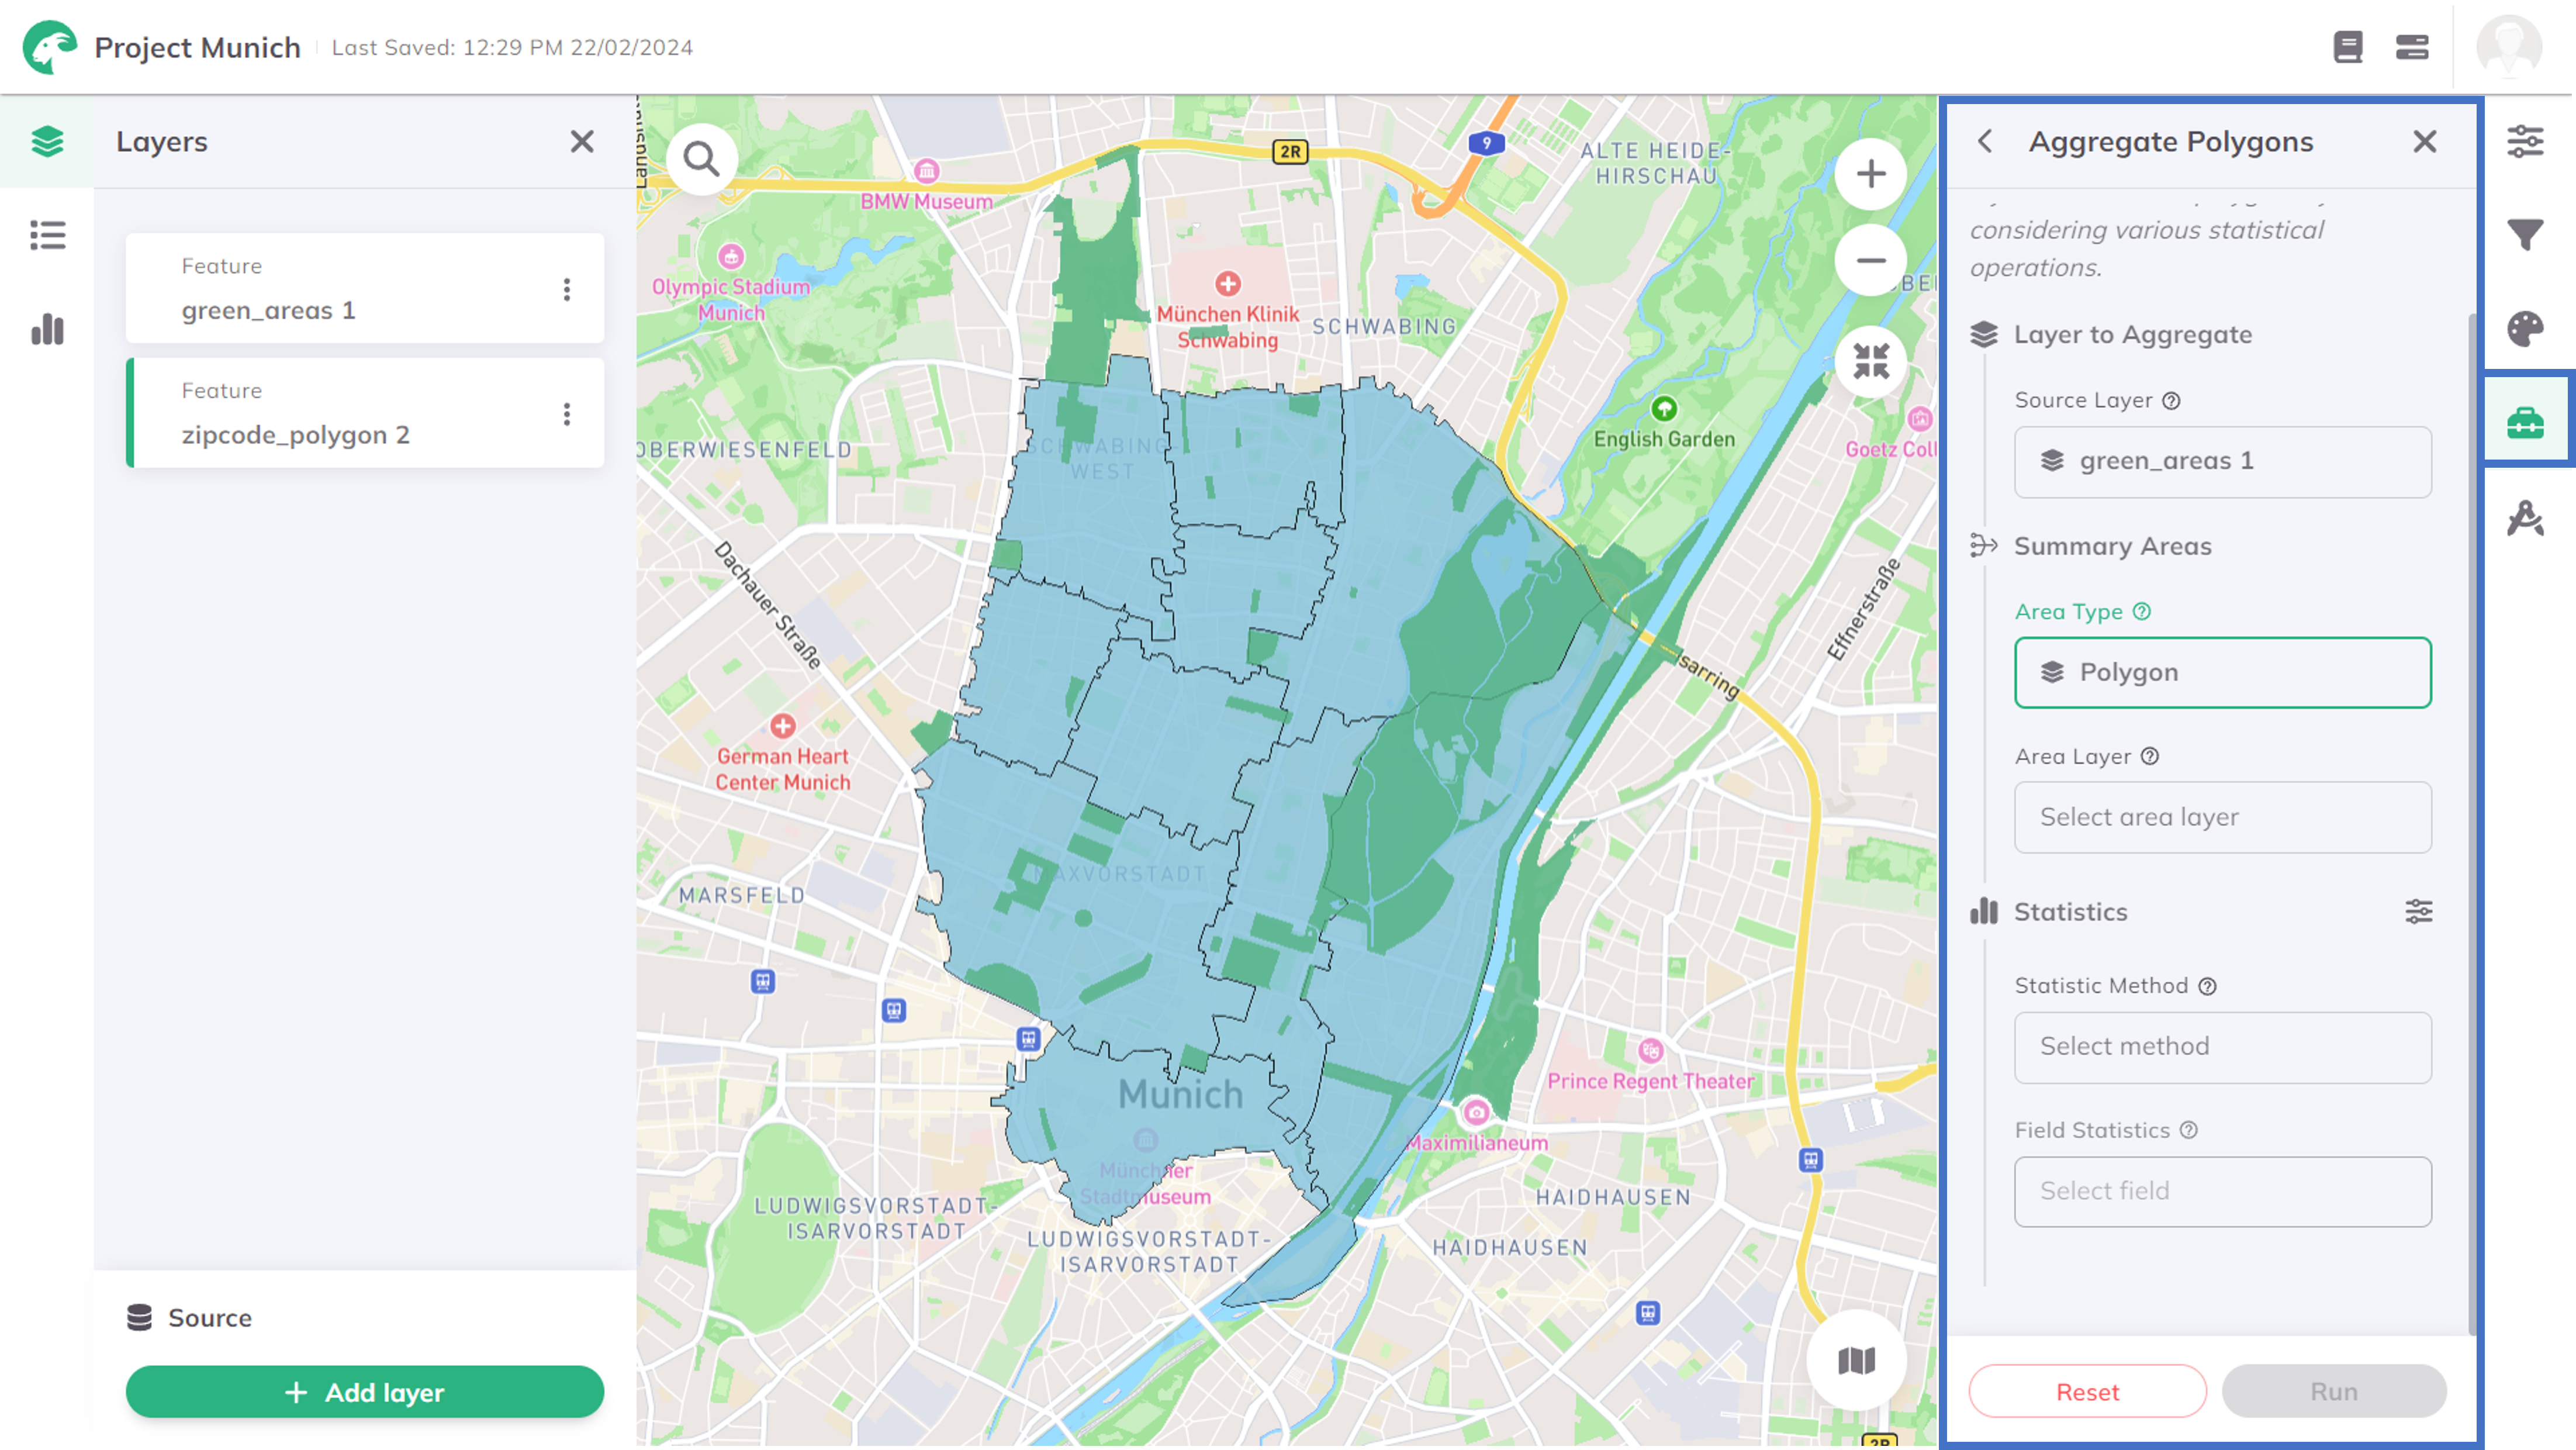
Toolbox Geoanalysis menu, click on Aggregate Polygons.
Layer to aggregate
Source Layer, which contains the data you like to aggregate. Area Type you like to aggregate the source layer. You can choose between Polygon or H3 grid.- Polygon
- H3 Grid
Polygon
Area Layer which contains the polygons on which you like to aggregate your point data.Statistics
Statistic Method and Field Statistics (the field in the source layer that is used to group the aggregation.).Available Statistics Methods are listed in the following. The available methods depend on the data type of the chosen attribute:
| Method | Type | Description |
|---|---|---|
| Count | string,number | Counts the number of non-null values in the selected column |
| Sum | number | Calculates the sum of all the numbers in the selected column |
| Mean | number | Calculates the average (mean) value of all numeric values in the selected column |
| Median | number | Yields the middle value in the selected column's sorted list of numeric values |
| Min | number | Yields the minimum value of the selected column |
| Max | number | Yields the maximum value of the selected column |
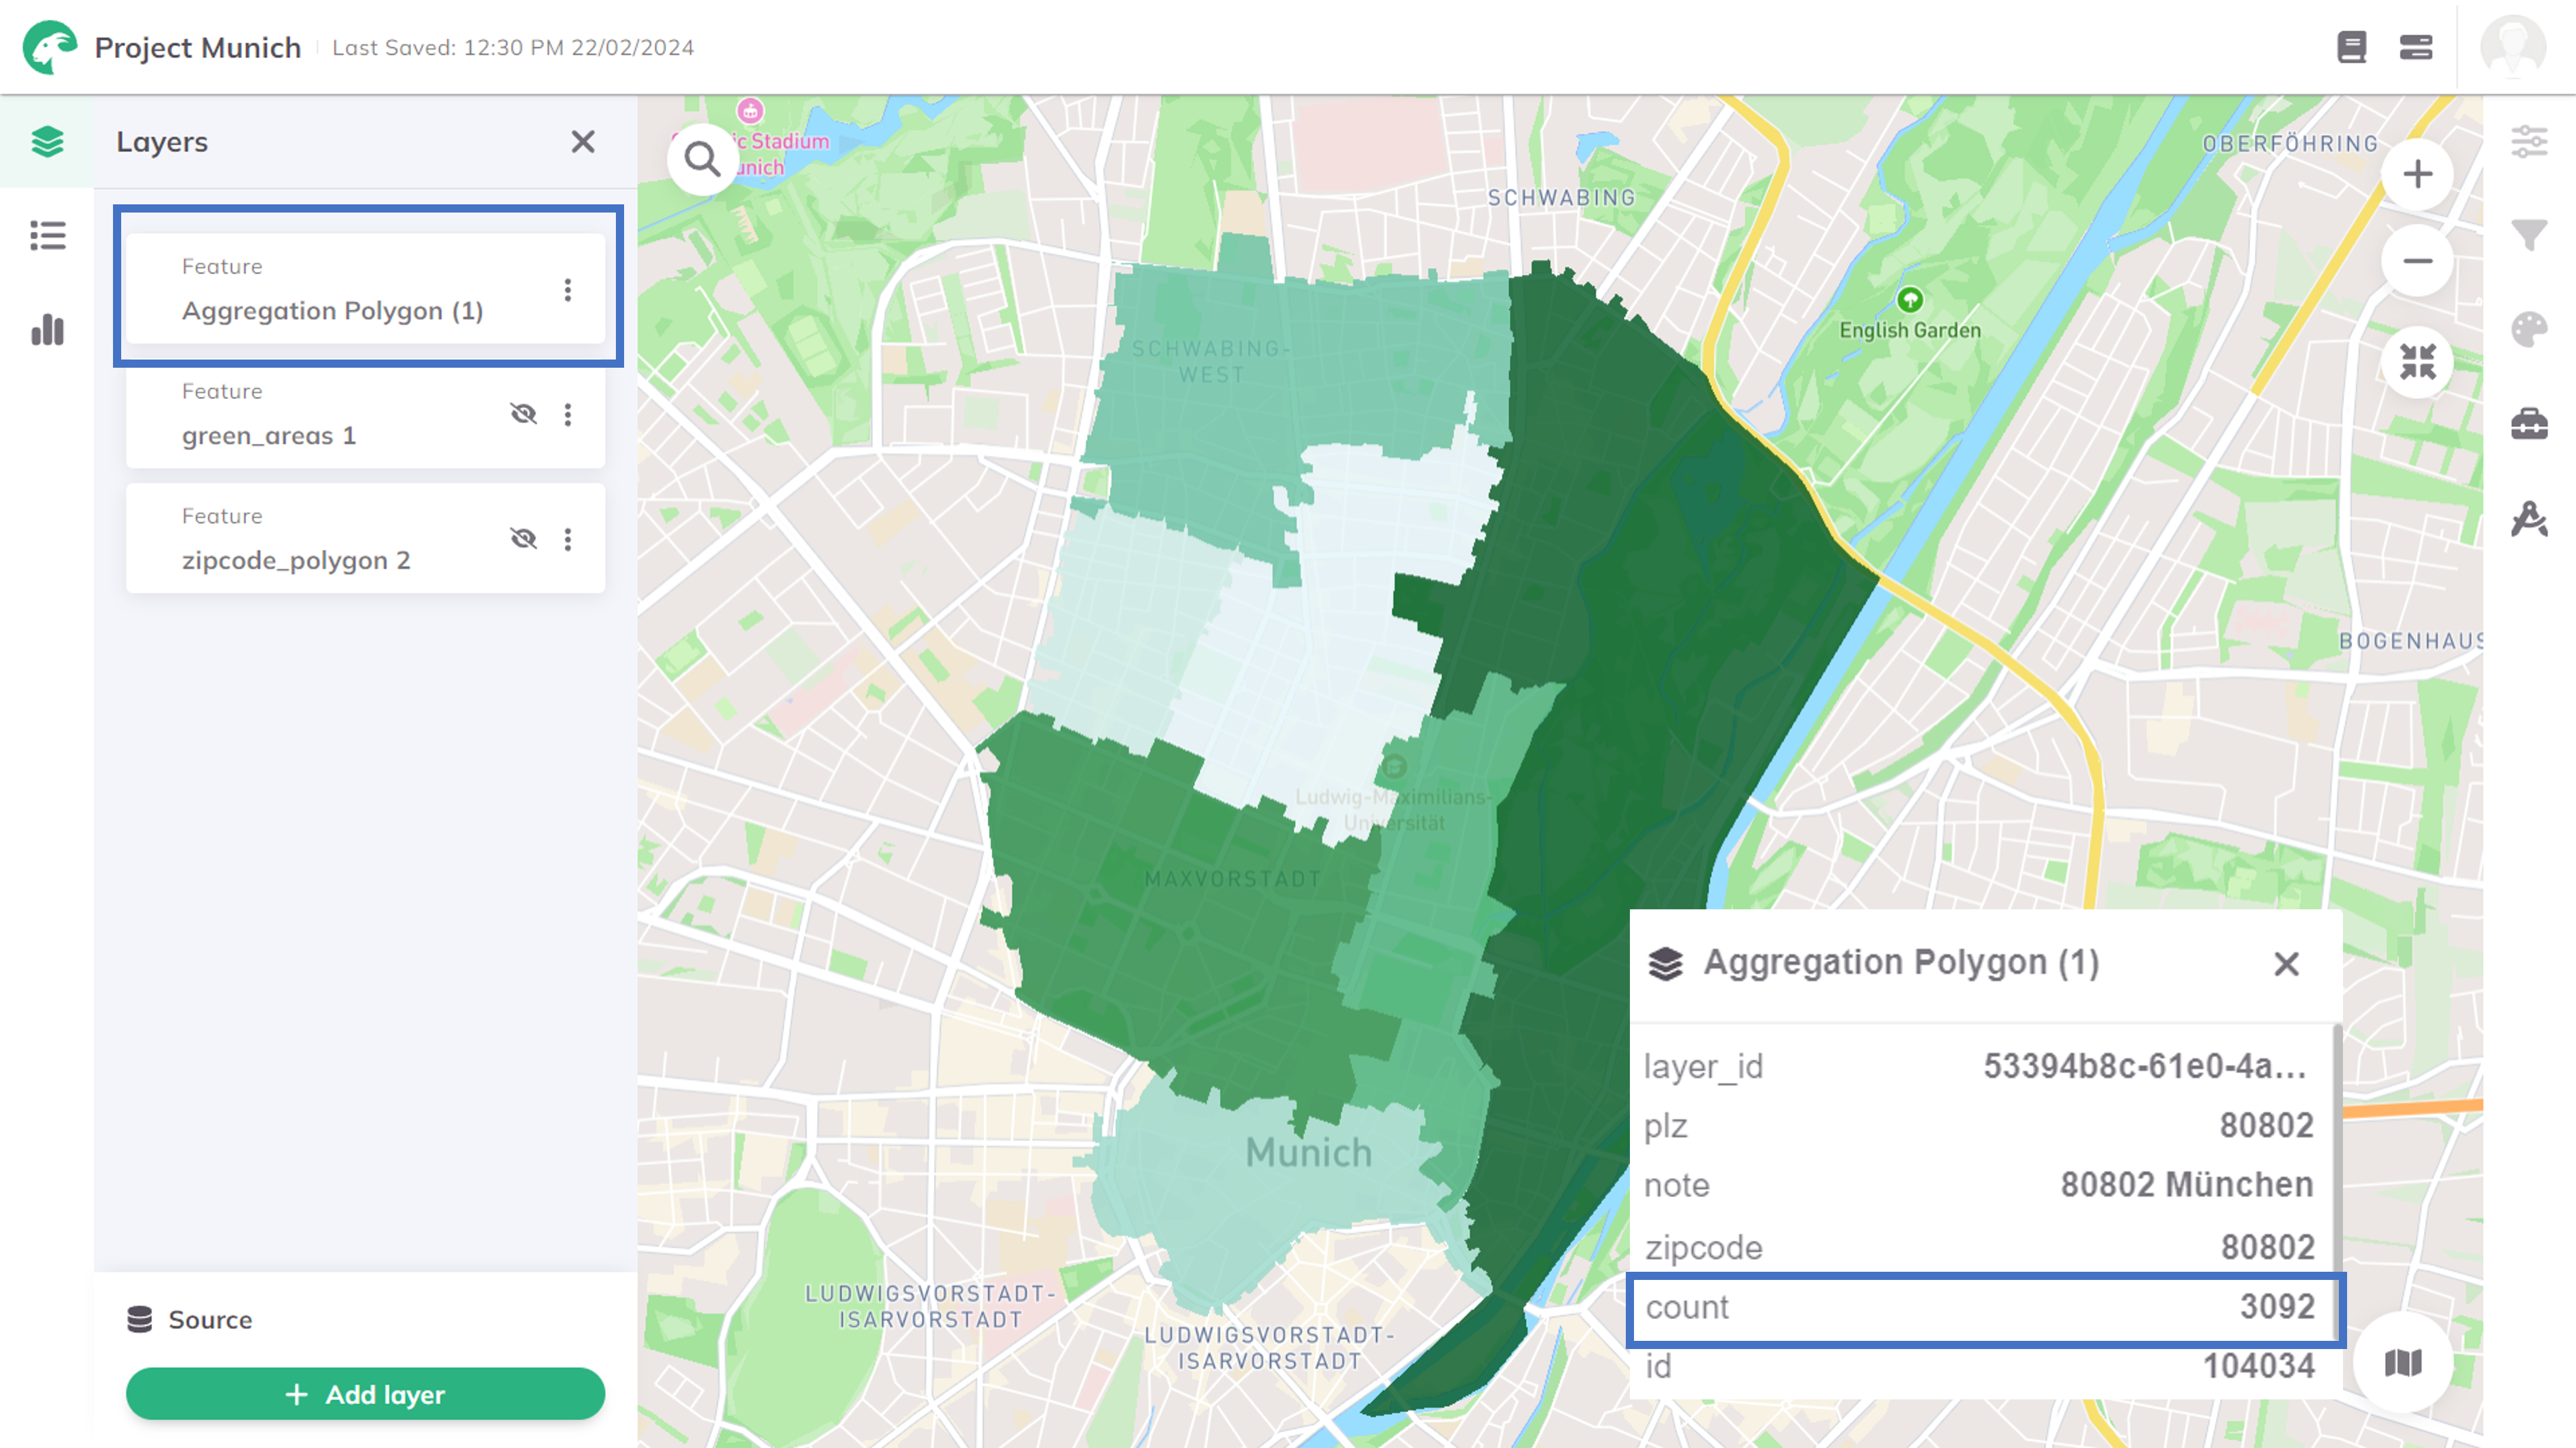
Run.Depending on the size of the datasets, the calculation might take some minutes. The status bar shows the current progress.
Results

Want to style your result layer and create nice-looking maps? See Styling.