Aggregate Polygons
The Aggregate Polygons tool performs statistical analysis of polygons, e.g. count, sum, min, or max, and aggregates the information on polygons.
1. Explanation
The Aggregate Polygons tool can be used to analyze the characteristics of polygons within a given area. It aggregates the information of the polygons and allows calculation of the polygon count, the sum of polygon attributes, or derive e.g. the maximum value of a certain polygon attribute within an aggregation area.
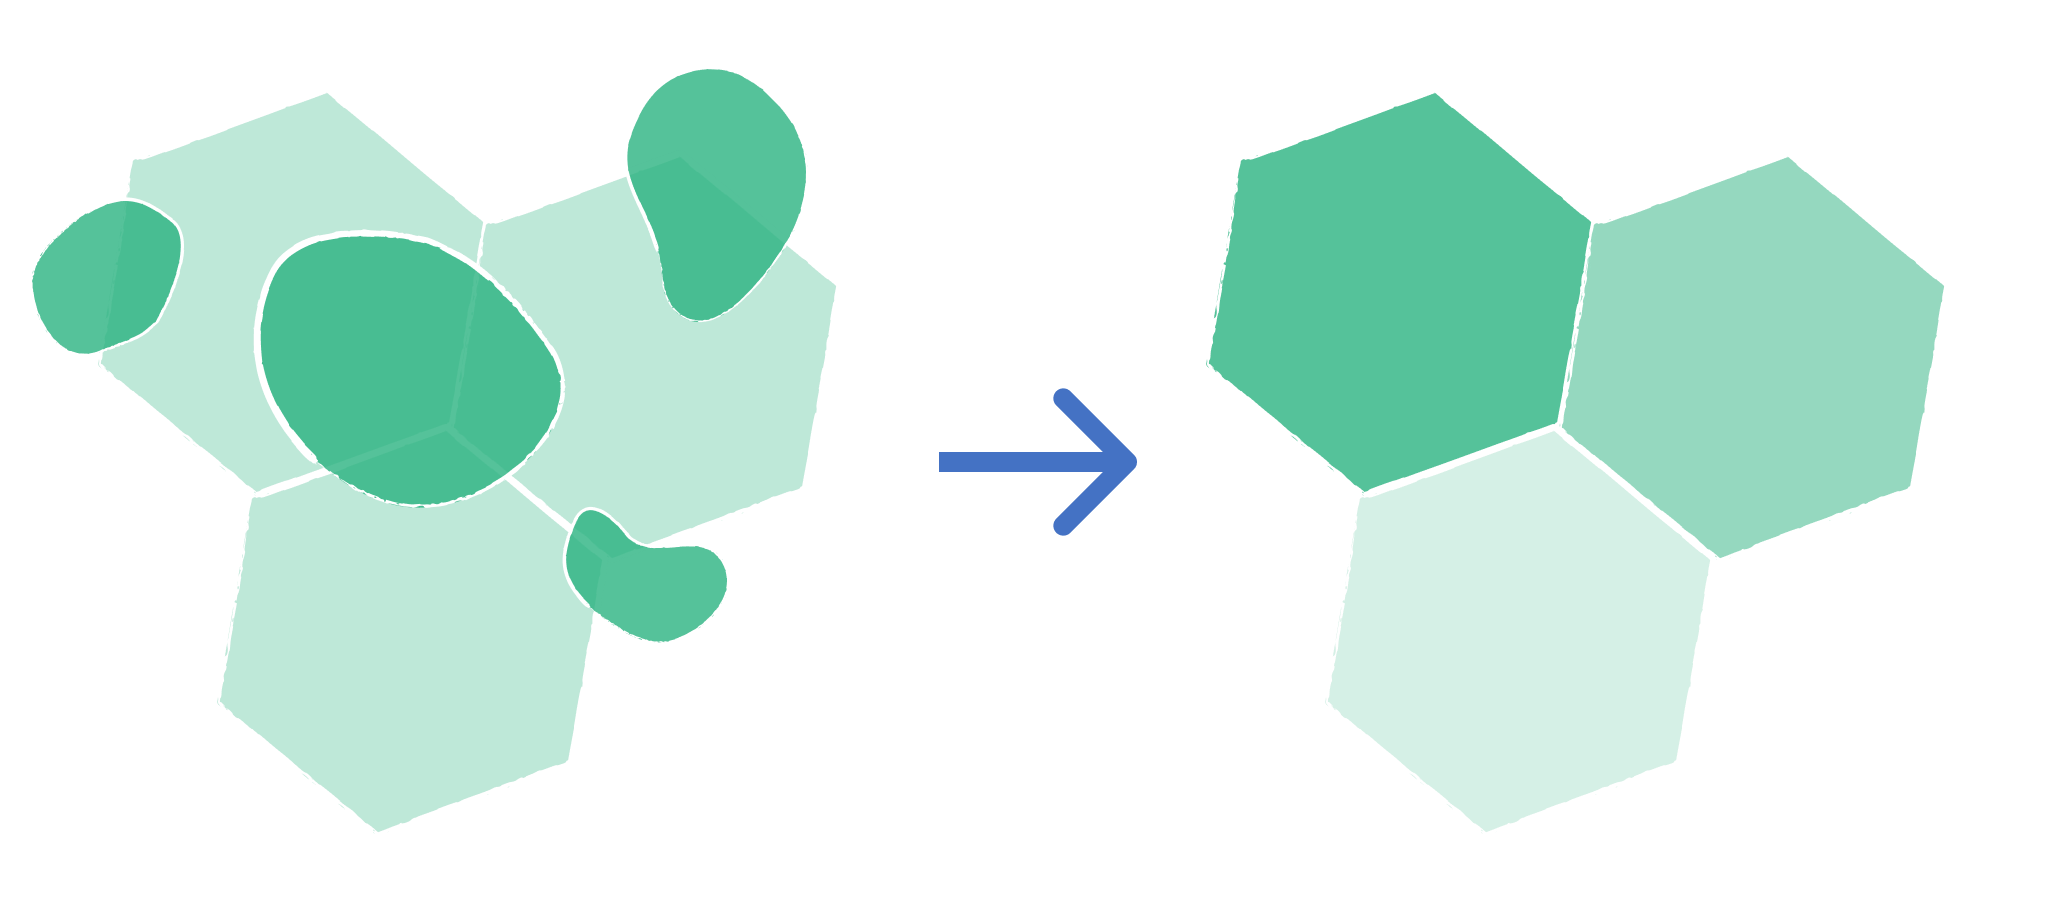
The example below shows the geometry of the Source Layer remains unchanged, while its attributes are enriched by aggregating information from the Area of Aggregation.
2. Example use cases
- Visualizing the number of parks per city district.
- Calculating the mean building size in an area.
- Aggregating population numbers on a hexagonal grid and calculating population densities.
3. How to use the tool?
Toolbox  .
. Geoanalysis menu, click on Aggregate Polygons.Layer to aggregate
Source Layer, which contains the data you like to aggregate.Summary Areas
Area Type you like to aggregate the source layer. You can choose between Polygon or H3 grid.- Polygon
- H3 Grid
Area Layer which contains the polygons on which you like to aggregate your point data.H3 Grid Resolution. You can choose resolutions between 3 (average edge length of 69km) and 10 (average edge length of 70m).To learn more about the H3 grid, you can visit the Glossary.
Statistics
Statistic Method and Field Statistics (the field in the source layer that is used to group the aggregation.).Available Statistics Methods are listed in the following. The available methods depend on the data type of the chosen attribute:
| Method | Type | Description |
|---|---|---|
| Count | string,number | Counts the number of non-null values in the selected column |
| Sum | number | Calculates the sum of all the numbers in the selected column |
| Mean | number | Calculates the average (mean) value of all numeric values in the selected column |
| Median | number | Yields the middle value in the selected column's sorted list of numeric values |
| Min | number | Yields the minimum value of the selected column |
| Max | number | Yields the maximum value of the selected column |
Weighted by Intersection Area by clicking on the options button . Therewith, aggregated values are weighted by the share of the intersection area between the Source Layer and the Aggregation Layer.Run.Results
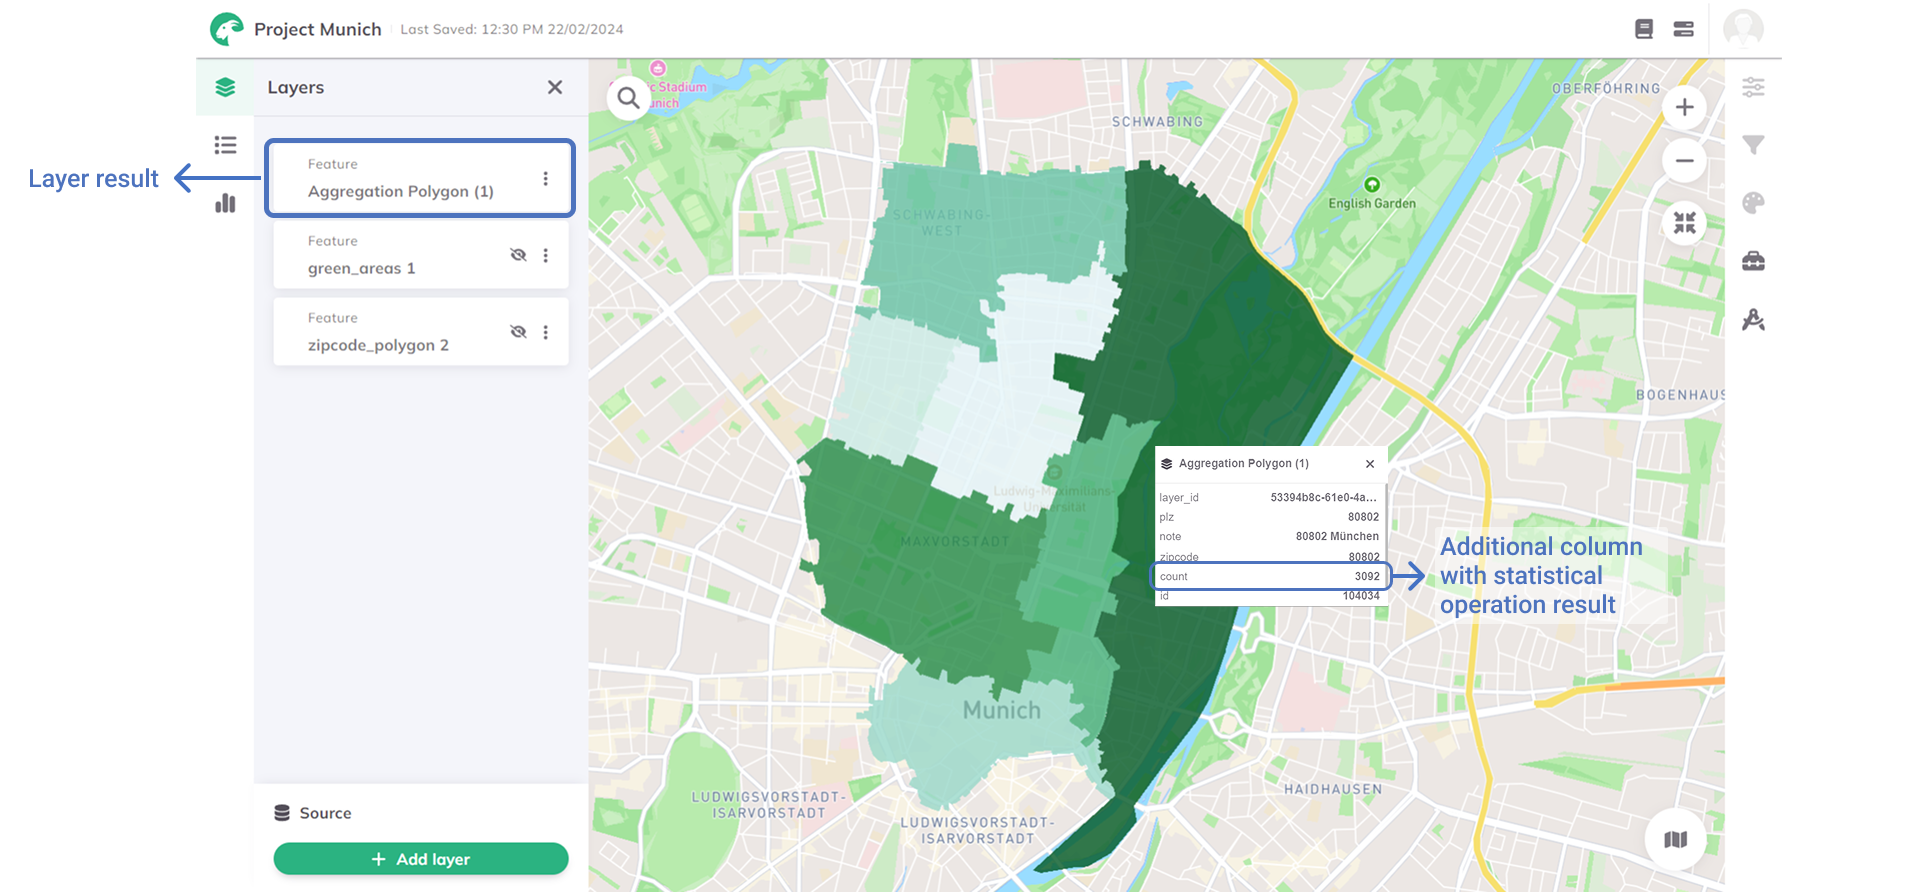
As soon as the calculation process is finished, the resulting layer Aggregation Polygon will be added to the map. The result layer will consist of the information of the source layer and an additional column showing the results from the statistical operation. You can see the table by clicking on the polygon on the map.
Want to style your result layer and create nice-looking maps? See Styling.