Style Your Results
Raw analysis results are powerful, but well-styled maps tell a compelling story. Let's make your catchment areas look professional!
Watch the Styling Tutorial
Styling Options in GOAT
1. Access Layer Styling
Right-click on your catchment layer in the Layer Panel and select Style or click the paint brush icon.
2. Choose a Color Palette
GOAT offers several color palette types:

Sequential palette - great for time-based data

Diverging palette - shows deviation from a midpoint
3. Apply Attribute-Based Styling
Style your catchments based on travel time values:

Applying color based on travel time attribute
Recommended Settings for Catchments
| Setting | Recommendation |
|---|---|
| Fill Color | Sequential green or blue palette |
| Fill Opacity | 50-70% (to see underlying map) |
| Stroke Color | Darker shade of fill |
| Stroke Width | 1-2 pixels |
4. Adjust Transparency
Lower the opacity to see the basemap underneath:
Selecting and customizing color palettes
5. Add Labels
Add informative labels to your catchments:
Adding labels to show travel time values
Color Scheme Recommendations
For accessibility analysis, consider these combinations:
| Analysis Type | Recommended Palette |
|---|---|
| Walking catchments | Greens (nature, pedestrian) |
| Cycling catchments | Blues (cool, active) |
| Transit catchments | Purples (urban, transit) |
| Car catchments | Oranges/Reds (caution, auto) |
Avoid red-green combinations as they're difficult for colorblind users. Use blue-orange or purple-yellow alternatives.
Save Your Style
Once you're happy with the styling:
- Click Save Style in the style panel
- Your style will be saved with the layer
- You can also save it as a default for future use
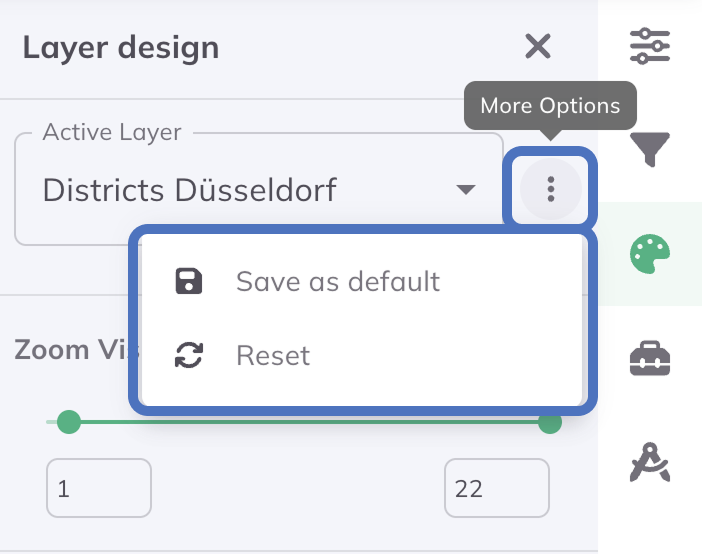
Save your style for future use
Next Step
Your map looks fantastic! Let's export and share your work.
Progress: 4 of 5 steps completed