Export & Share
Your analysis is complete and beautifully styled. Now let's export it for reports and share it with stakeholders!
Export Options
GOAT provides multiple ways to share your work:
1. Export as Image/PDF
Create high-quality maps for presentations and reports:
- Click the Print/Export button in the toolbar
- Choose your format (PNG, PDF)
- Set the resolution and paper size
- Add title, legend, and scale bar
- Click Export
2. Export Data
Download your analysis results for use in other applications:
| Format | Use Case |
|---|---|
| GeoJSON | Web applications, lightweight sharing |
| GeoPackage | Desktop GIS (QGIS, ArcGIS) |
| Shapefile | Legacy systems, compatibility |
| CSV | Spreadsheet analysis |
3. Share Project Link
Share your interactive map with others:
- Click Share in the project menu
- Set visibility (public, team, or specific users)
- Copy the shareable link
- Recipients can view and interact with your map
Creating a Professional Map Layout
For reports and presentations, include:
- Title - Clear, descriptive heading
- Legend - Explain what colors mean
- Scale Bar - Show distances
- North Arrow - Orientation reference
- Data Source - Credit your data
- Date - When the analysis was done
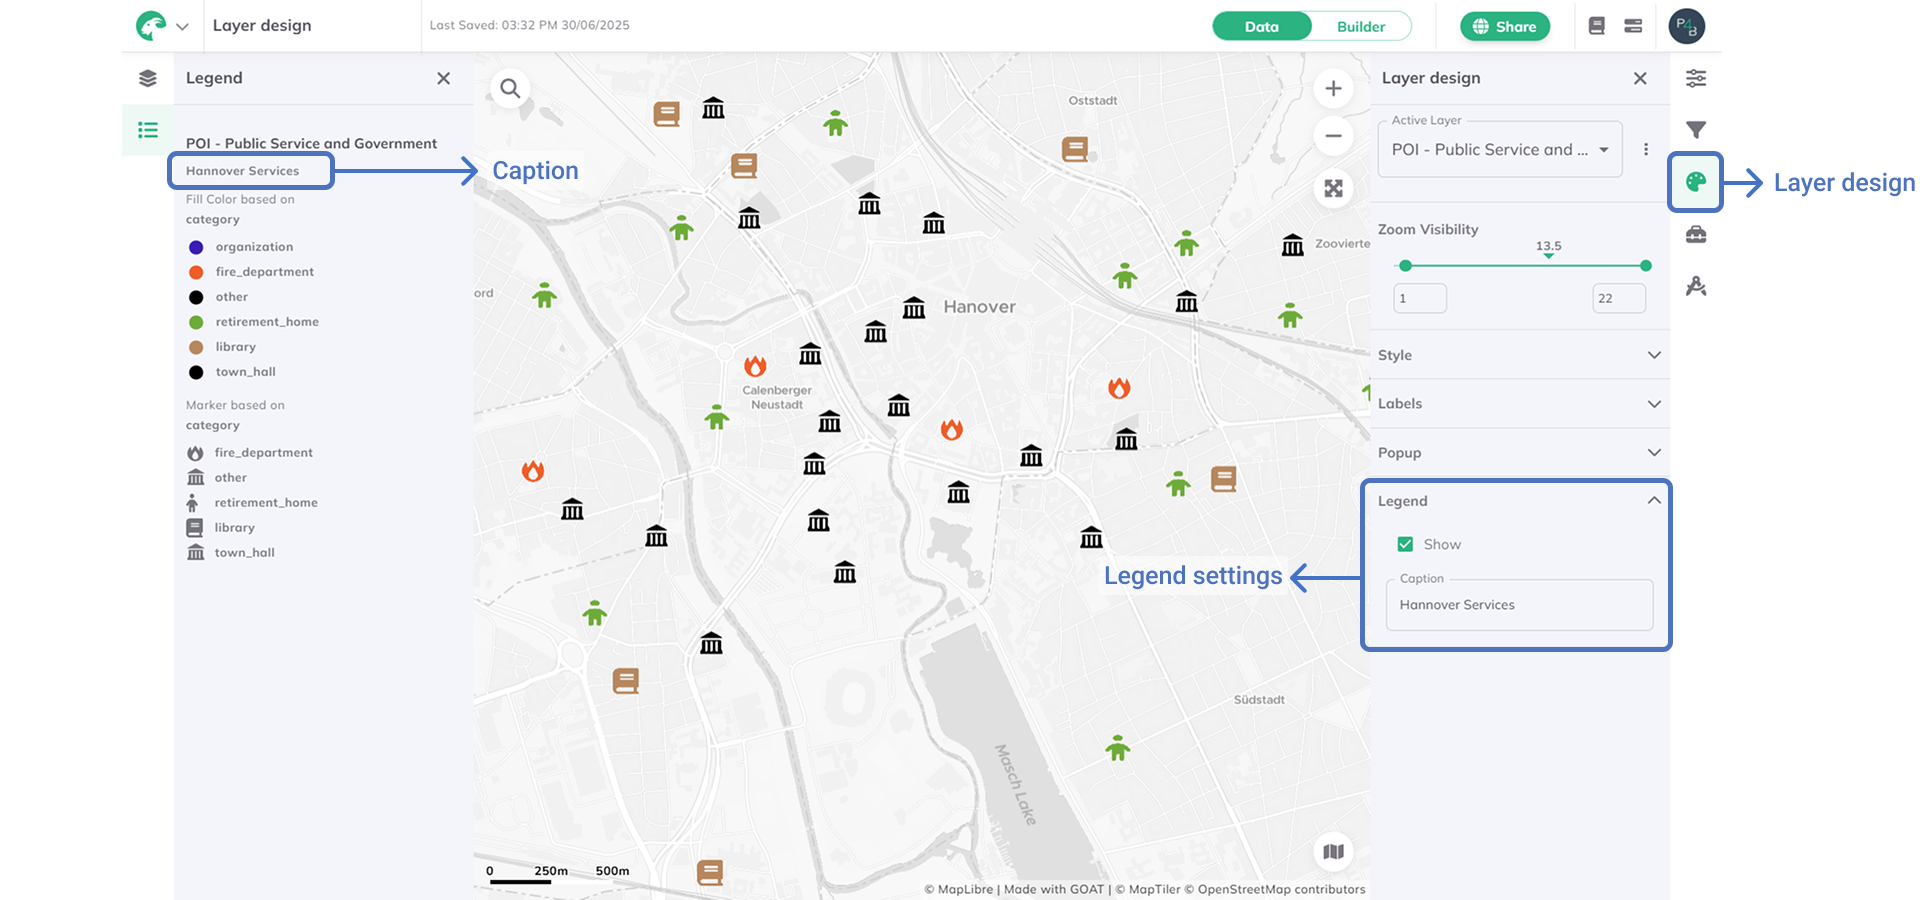
A well-designed legend helps readers understand your map
Best Practices for Sharing
For Stakeholder Presentations
- Use clear, non-technical language in titles
- Include a brief methodology note
- Highlight key findings with annotations
- Provide context (what does 15 minutes walking mean for residents?)
For Technical Reports
- Include coordinate reference system information
- Document all analysis parameters
- Provide raw data download links
- Add uncertainty/limitation notes
🎉 Congratulations!
You've completed your first accessibility analysis in GOAT!
What You Learned
- ✅ Creating and organizing projects
- ✅ Uploading and managing datasets
- ✅ Running catchment area analysis
- ✅ Styling results professionally
- ✅ Exporting and sharing your work
What's Next?
Now that you've mastered the basics, try these advanced tutorials:
- Heatmap Analysis - Create gravity-based accessibility heatmaps
- Scenario Planning - Model "what-if" scenarios for urban planning
🏆 Tutorial Complete!
You're now ready to perform professional accessibility analyses in GOAT. Happy mapping!