Run Comparative Analysis
The real power of scenario planning comes from comparing your intervention against the baseline. Let's quantify the impact of your changes!
Running Analysis in Scenario Mode
When a scenario is active, any analysis you run uses the scenario data instead of baseline.
Step-by-Step: Compare Catchments
Baseline Analysis:
- Deactivate your scenario (return to baseline)
- Run catchment area analysis from existing facilities
- Save/note the results
Scenario Analysis:
- Activate your scenario
- Run the same catchment analysis
- The new facility will be included
Step-by-Step: Compare Heatmaps
For a more comprehensive view:
1. Generate Baseline Heatmap
- Switch to baseline mode
- Run gravity heatmap analysis
- Name the result "Baseline_Accessibility"
2. Generate Scenario Heatmap
- Activate your scenario
- Run same heatmap analysis (same parameters!)
- Name the result "Scenario_Accessibility"
3. Calculate Difference Use GOAT's comparison tools or export data to calculate:
$$ \Delta A = A{scenario} - A{baseline} $$
Where positive values = accessibility improvement.
Visualizing the Comparison
Side-by-Side View
Use GOAT's split-screen or swipe tool to compare:
- Left: Baseline accessibility
- Right: Scenario accessibility
Difference Map
Create a "change map" showing:
| Color | Meaning |
|---|---|
| 🟢 Green | Accessibility improved |
| ⚪ White/Gray | No change |
| 🔴 Red | Accessibility decreased |
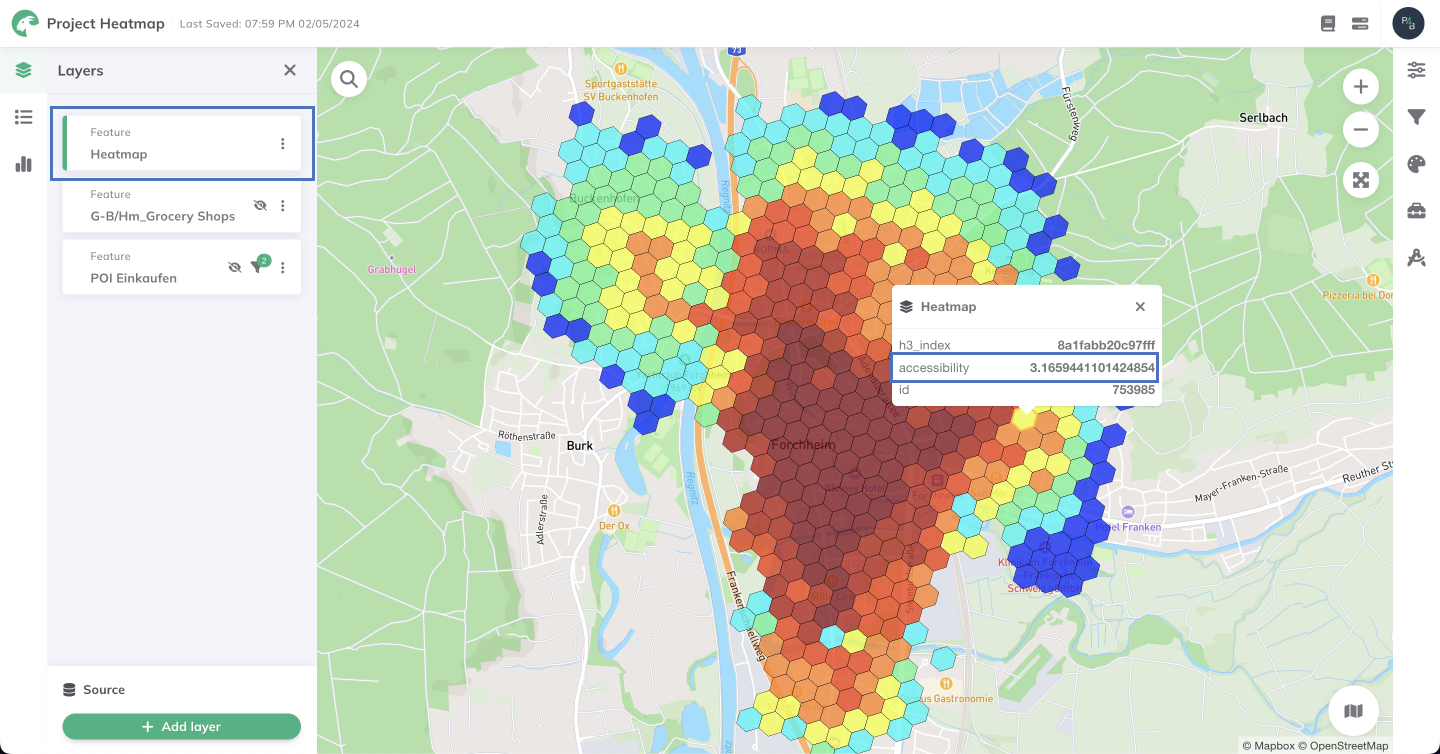
Heatmap showing accessibility distribution
Quantifying Impact
Key Metrics to Calculate
Coverage Metrics:
- Number of people within 15-min walk (before vs. after)
- Percentage of area with "good" accessibility
- Average accessibility score change
Equity Metrics:
- Improvement in underserved areas
- Change in accessibility for vulnerable populations
- Reduction in accessibility inequality (Gini coefficient)
Example Analysis Results
For our community center scenario:
| Metric | Baseline | Scenario | Change |
|---|---|---|---|
| Pop. within 15min | 12,500 | 18,200 | +5,700 (+46%) |
| Avg. accessibility | 245 | 312 | +67 (+27%) |
| Low-access areas | 34% | 22% | -12 points |
Comparing Multiple Scenarios
If you created multiple location options:
Decision Matrix
| Criterion | Weight | Option A | Option B | Option C |
|---|---|---|---|---|
| Population served | 30% | 5,700 | 6,200 | 5,100 |
| Low-income pop. served | 25% | 2,100 | 1,800 | 2,400 |
| Construction cost | 20% | €2.5M | €3.1M | €2.2M |
| Transit access | 15% | Good | Excellent | Fair |
| Land availability | 10% | Yes | Partial | Yes |
| Weighted Score | 100% | 78 | 82 | 71 |
Don't just optimize for one metric. Consider accessibility, equity, cost, and feasibility together.
Statistical Tests
For robust analysis, consider:
- T-test: Is the average accessibility significantly different?
- Spatial autocorrelation: Are improvements clustered?
- Sensitivity analysis: How do results change with different parameters?
Next Step
You have compelling results! Let's present your findings effectively.
Progress: 3 of 4 steps completed