Run Catchment Analysis
Catchment areas (isochrones) show you all the areas reachable from a point within a certain time or distance. This is the core of accessibility analysis!
Watch How It Works
Understanding Catchment Areas
A catchment area answers: "Where can I reach from this location within X minutes?"
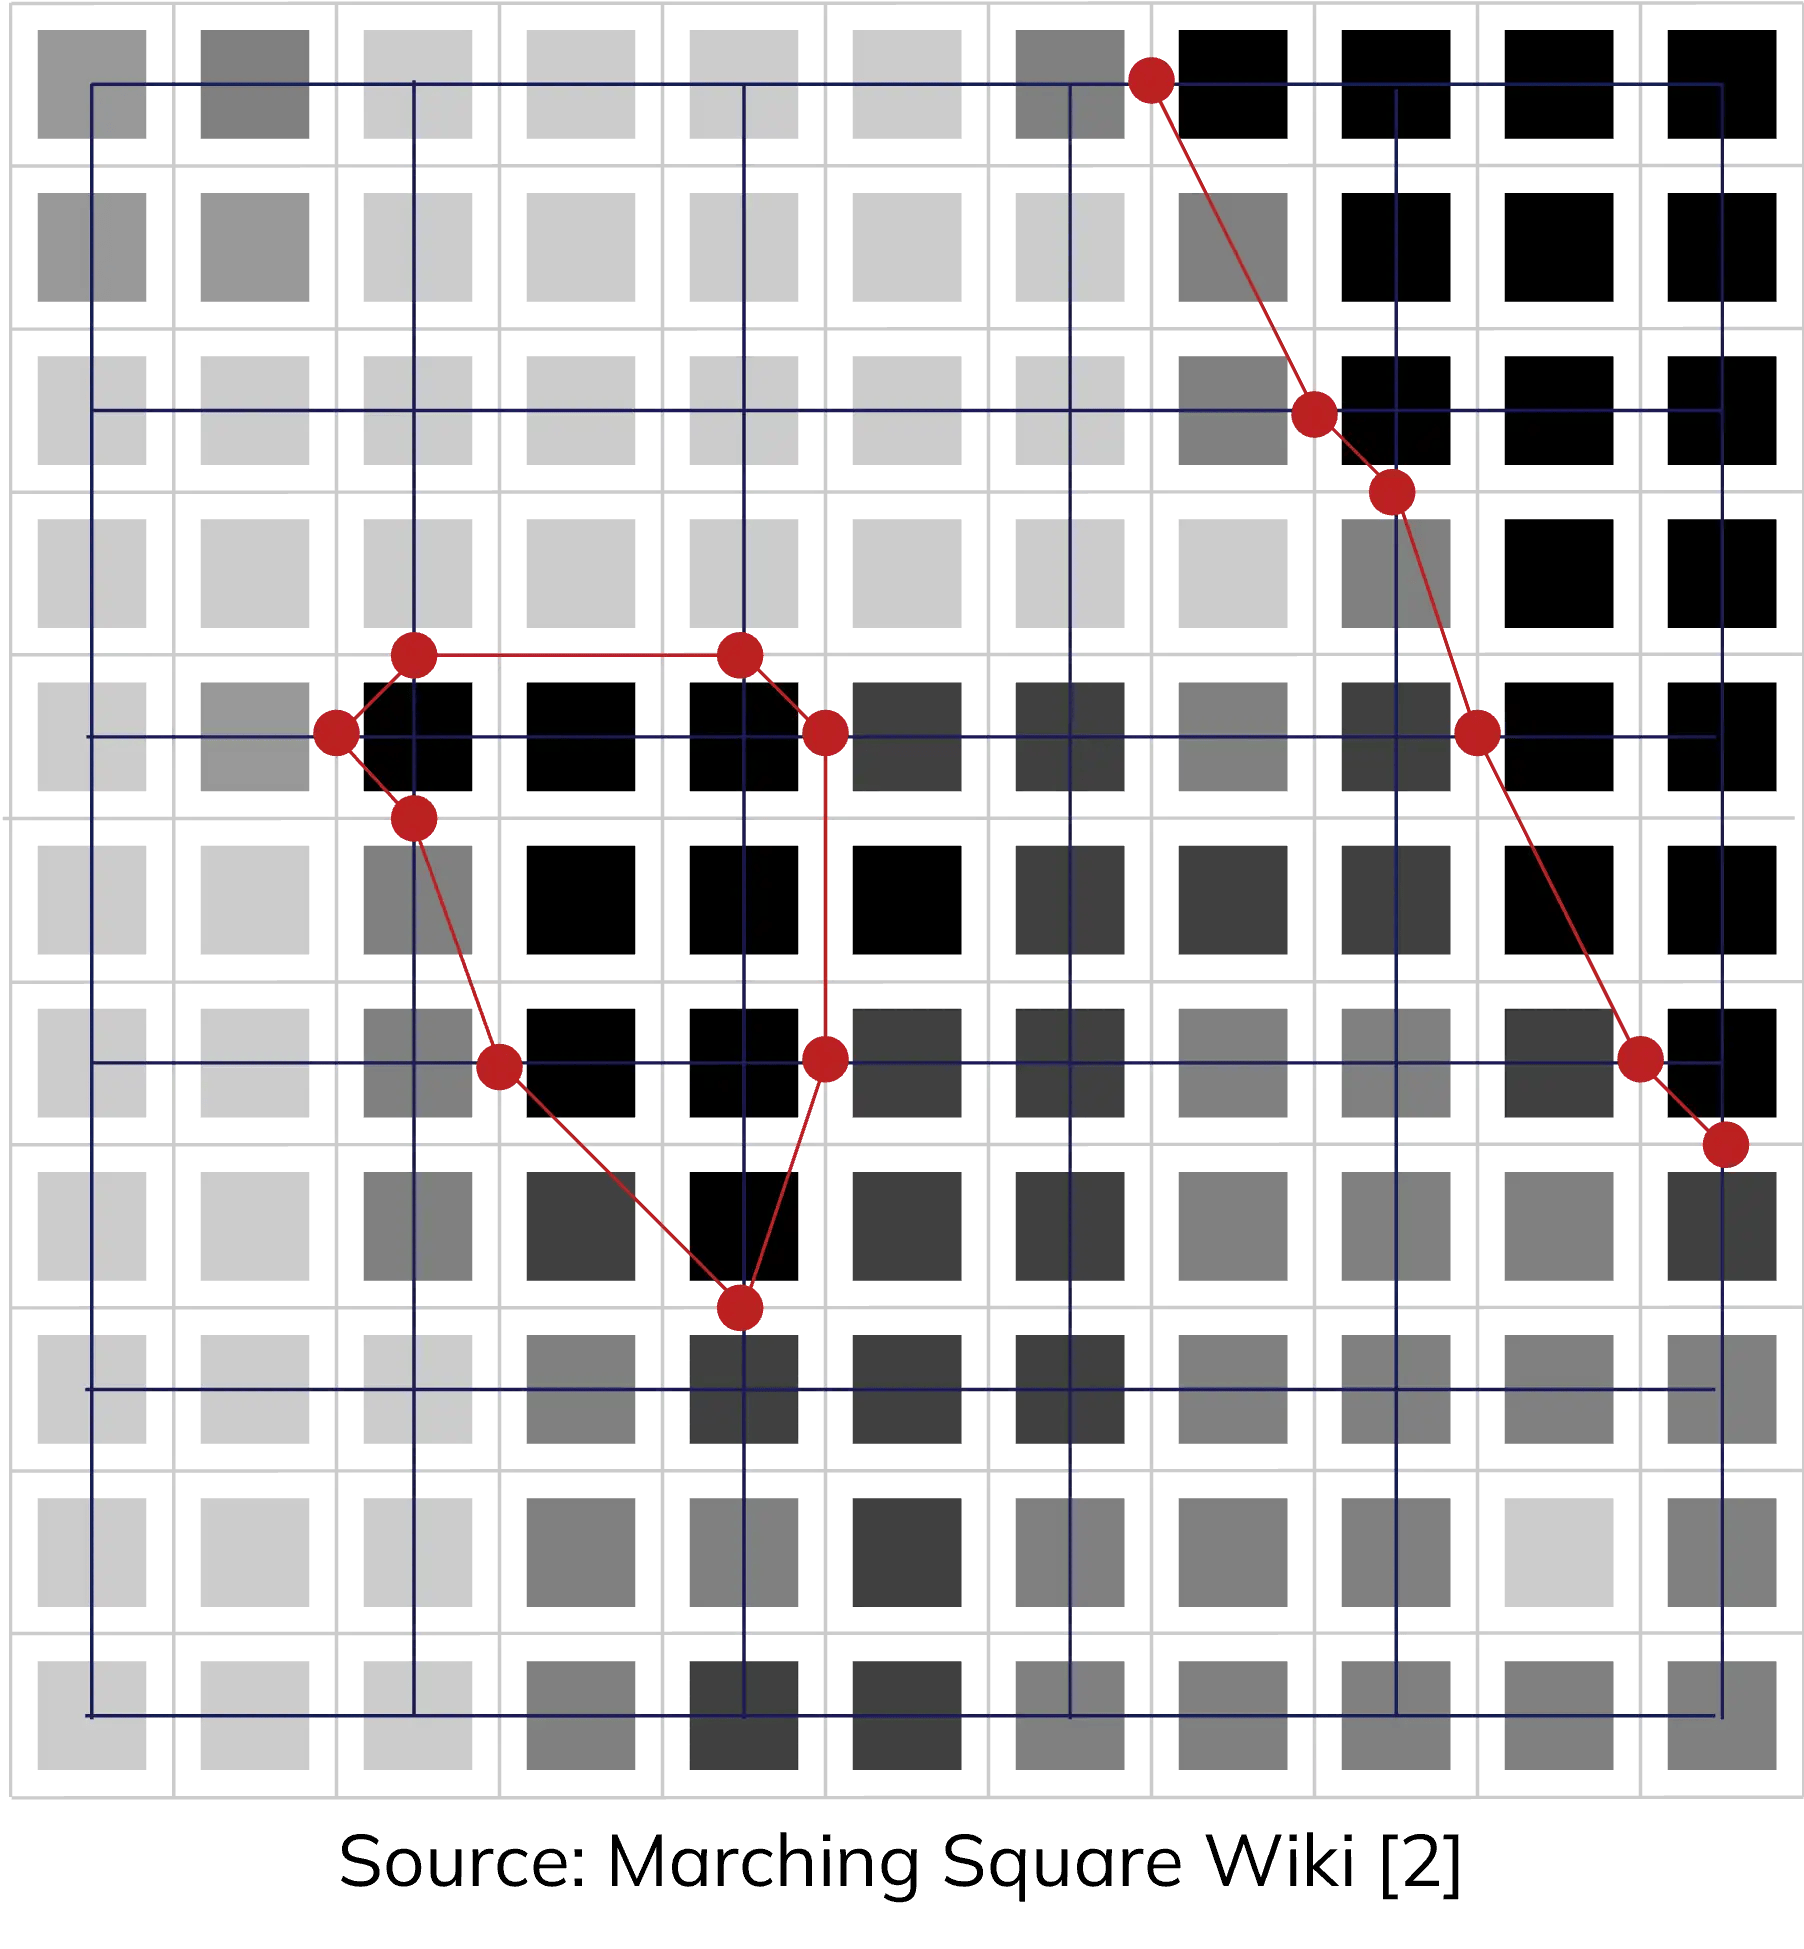
Catchment areas visualize reachable zones
Step-by-Step Instructions
1. Open the Toolbox
Click on the Toolbox icon in the sidebar to access all analysis tools.
2. Select Catchment Area Tool
Navigate to Accessibility Indicators → Catchment Area
3. Configure Your Analysis
Select Starting Points
Choose your uploaded POI layer as the starting points for the analysis.
Choose Transport Mode
| Mode | Best For | Typical Speed |
|---|---|---|
| 🚶 Walking | Short distances, pedestrian access | 5 km/h |
| 🚴 Cycling | Medium distances, bike infrastructure | 15 km/h |
| 🚗 Car | Longer distances, road network | Variable |
| 🚌 Public Transit | Urban areas with transit | Schedule-based |
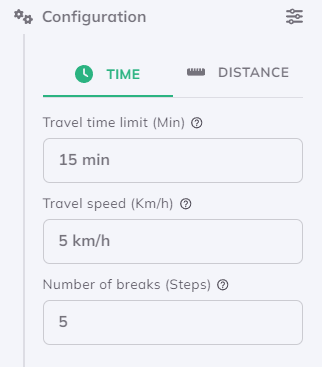
Configuring walking catchments by time
Set Travel Time/Distance
For this tutorial, try:
- 5 minutes - Very close proximity
- 10 minutes - Comfortable walking distance
- 15 minutes - Extended walking range
4. Run the Analysis
Click Run and watch GOAT calculate your catchments!
Catchment areas being calculated
Understanding the Results
Your catchment results show:
- Polygons representing reachable areas
- Multiple rings for different time thresholds
- Attribute data with travel times and areas

Catchment polygons with time intervals
Enable Polygon Difference to create non-overlapping rings, making it easier to see each time band distinctly.
Next Step
Your catchments are calculated! Now let's style them beautifully.
Progress: 3 of 5 steps completed